


Data products available: Ascii text
files for each observed object containing a list of total flux (in
magnitudes), degree of linear polarization, and electric-vector
position angle of polarization for each of the colors from all of our
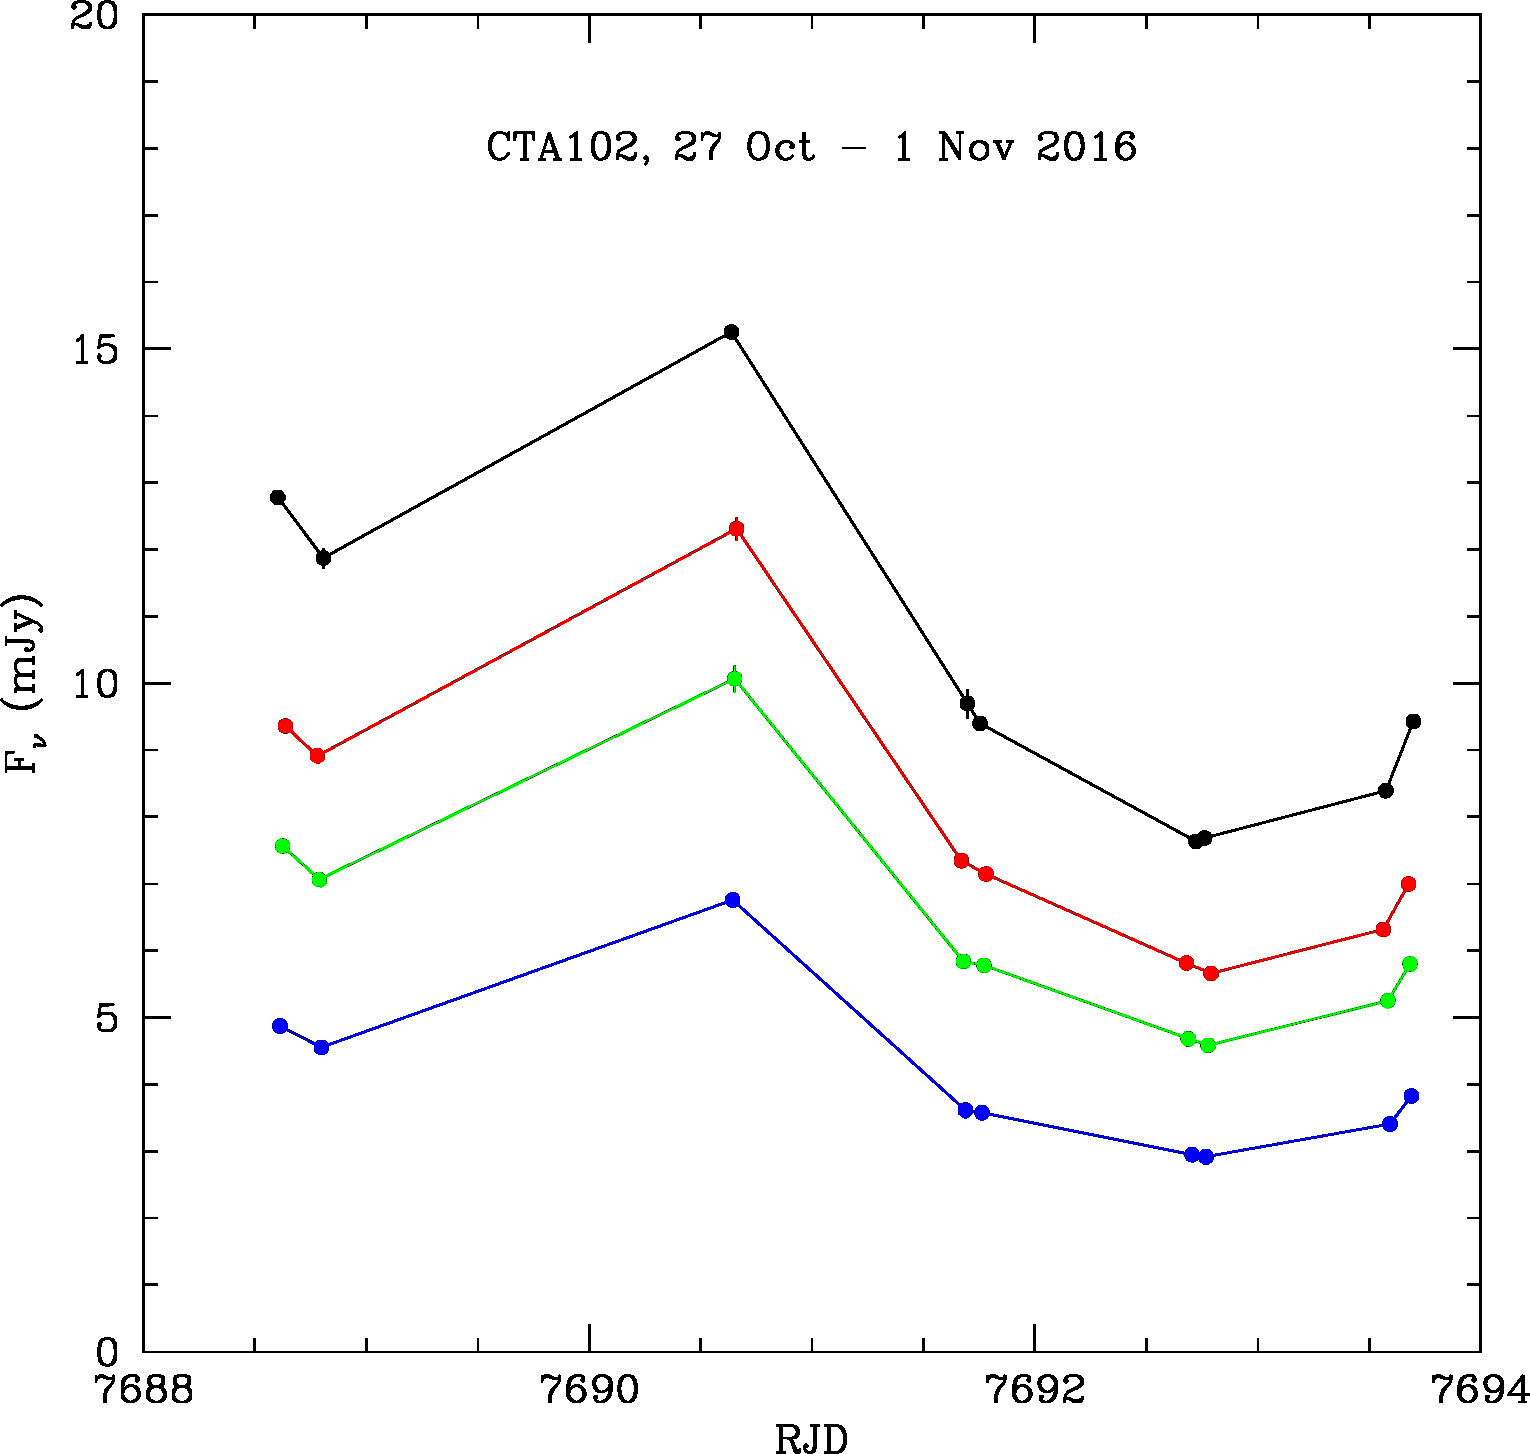
measurements under the MOBPOL program. As in the graphs above, time is
measured in RJD, which is Julian date minus 2450000. For reference,
midnight at the start of 2017 was RJD 7754.5. There is a website where
you can convert Julian dates to calendar dates.
3C 66A 0716+714
OJ287 0954+658 Mkn421 1156+295 1222+216
3C 279 PKS
1510-089 Mkn501 1749+096 1959+650
BL Lac CTA102
Other data products: Most of the objects in the MOBPOL program are part of the VLBA-BU-BLAZAR program, which has a separate web page. There you can find a list of the blazars and radio galaxies observed in that program; click on the source of interest to connect to the images, data files, and plots. One of those plots is a graph of gamma-ray flux, X-ray flux, optical R-band flux, optical R-band degree of polarization, and electric-vector position angle of the polarization, all plotted vs. time. Roughly monthly VLBA images in both total and polarized intensity at 43 GHz can be viewed and downloaded from the same web pages. Snapshot spectral energy distributions for most of the objects can be found in our group's Williamson et al. (2014) paper (Astrophysical Journal, vol. 789, p. 135).
Note: If you use any of these images or data
in a publication, please acknowledge via the statement:
This study makes use of data from the MOBPOL program conducted
by S. Jorstad and A. Marscher at Boston University, and
supported in part by the National Science Foundation under grant
AST-1615796.
Disclaimer: Any opinions, findings, and conclusions or recommendations expressed here are those of the investigators, and do not necessarily reflect the views of the National Science Foundation.
The light from the high-energy plasma (charged
particles and magnetic field) of a blazar jet is from synchrotron
radiation - electrons executing spiral motions at velocities very close
to the speed of light. Light is actually a wave of oscillating electric
and magnetic field that moves through space, with the electric and
magnetic fields perpendicular to each other and also perpendicular to
the direction of motion. (You can find an animation of
polarized light on a YouTube video.)
The light is said to be
unpolarized if the different waves passing the observer have have
polarizations that are equally in one direction as in the perpendicular
direction. This can happen, for example, if the polarization
orientation has utterly random
directions of the electric field, or if 50% of the waves have
polarization in one direction and the
other 50% (coming from a different region in the source) have
polarization perpendicular to this. This is because mutually
perpendicular polarizations cancel each other. In contrast, the light
is 100% linearly
polarized if the electric field is always in the same direction.
(Actually, the field oscillates back and forth along that direction.)
Detailed calculations find that synchrotron light can have linear
polarization as high as about 75%. The synchrotron light is polarized
at less than 75% if only some fraction of the waves have the same
electric field direction.
A key feature of synchrotron light is that the net
electric field of the polarization (the electric
vector position angle, or EVPA, often represented by the Greek letter
χ),
is perpendicular to the direction of the magnetic field as viewed by
the observer (i.e., as projected onto the plane of the sky).
(Note that this is not always true for synchrotron light at radio
wavelengths, whose EVPA can be
changed by an effect called Faraday rotation.)
So, measuring the polarization of optical light can
tell us quite a bit about the magnetic field. Is it mixed up, in a
spaghetti-like pattern, as one might expect from turbulence? Or does it
have a high level of order, for example in a helical (spiral) pattern
wrapped
around the jet or perhaps either parallel or perpendicular to the jet?
This is
important because the magnetic field is thought to play an important
role in the dynamics of the jet, including its formation, acceleration
to near-light speed, and constriction into a very narrow cone shape.
The powerhouse of a blazar is a black hole with a mass about a billion
times the mass of the Sun, accreting gas from its surroundings, but the
main tool that the black hole uses to make two oppositely-directed jets
is the magnetic field brought toward
it by the accreted ionized gas. The field is wound up into a helical
shape by the rotation of the black
hole and the orbits of the infalling gas. The magnetic field is also
likely to play the major role in the energization of the electrons
whose radio, infrared, visible, UV, X-ray, and gamma-ray light we
observe from blazars. Changes in velocity of the plasma flowing down
the jet, away from the black hole at the center of the host galaxy, can
form shock waves. If the magnetic field lies nearly perpendicular to
the shock wave's front, some of the electrons (as well as protons) can
pass across the shock and back numerous times, gaining a lot of energy
in the process. Or, in regions where the magnetic field is mixed up,
regions of oppositely directed field can come together, annihilating
some of the field in a process called magnetic reconnection, and
transferring the lost magnetic energy into energy of the electrons.
By measuring the polarization of a blazar's light and
how it changes with time and wavelength, we can determine the pattern
of the magnetic field in the jet and compare the data with the
predictions of the different hypotheses for how the electrons gain the
energies needed to radiate the optical (and gamma-ray, as well as X-ray
in some blazars) light. To do
this, we need to collect enough data to determine whether repeatable
patterns, or just random fluctuations, occur. We expect to be able to
determine this in 2019 after 3 years of observations.
For more information on blazars, see our research page.
Back to the blazar group's home page
Go to the personal web pages of: Alan Marscher ---- Svetlana Jorstad