Identifying When a Customer is Lost?

By Timothy Webb, Ph.D., Assistant Professor, Alfred Lerner College of Business and Economics, University of Delaware, Mark Legg, Ph.D., Assistant Professor of Hospitality Analytics, Boston University School of Hospitality Administration, and Michael Mancini, Ph.D., Industry Consultant
Customer loyalty is fundamental to the success of any hospitality organization. The industry relies on B2C interactions that drive customer loyalty through incentives with various benefits (Yoo and Bai, 2013). Recognizing this, airlines and casinos began offering loyalty programs in the late 1990s (Law et al., 2018; Loveman, 2003). While these programs made it more viable to identify their most valuable customers, they also provided a wealth of information such as customer demographics and spending preferences. This vast data could be leveraged to increase retention, drive revenues, and grow visitation by properly incentivizing customers (Legg, Webb & Ampountolas, 2021).
Recent advances in data analytics have enhanced the value-add of loyalty programs. Companies such as Starbucks are now pushing more sales through loyalty engagements such as reward tiers, targeted promotions, product recommendations, menu updates, and re-engagement initiatives (Marr, 2018). These programs can also directly communicate with desired customers through mobile and web apps while giving firms the opportunity to track customers’ responses, visits, and purchasing history. From here, predictive models can be developed to optimize loyalty engagements to build loyalty and mitigate customer churn.
“Customer churn” is defined as customers that stopped visiting or spending during a specified period. Firms use various approaches to identify customers’ churn, from advanced statistical models to static definitions of fading customers. However, the approach to identifying churn is not always readily apparent and the same across industry sectors. For example, contractual-based businesses such as telecommunications, streaming services, and financial services are dependent on the number of subscribers or users. In this setting, customers are easily classified as active or inactive through a form of payment. If a customer cancels or does not pay, they are no longer subscribed to the service provided, and their inactivity is known.
Conversely, the hospitality industry operates in a non-contractual setting, where customer loyalty and brand switching behavior are largely unknown. While loyalty programs actively collect visitation data, these companies struggle to identify when a customer is no longer patronizing or has been lost to the competition. Many of these firms have relied on subjective cutoffs, built from management intuition to trigger a promotion based on the number of days from the customer’s previous visit (one week, one month, one year, etc.). The challenge with this approach is that these predefined values do not apply to all customers. Some customers visit very frequently, while others visit more sparingly. This retention strategy can lead to prioritizing one group over another and wasting marketing resources from mistimed promotions. For example, consider a firm that sends a retention offer to a customer who has not visited for one month. A customer who visits weekly may be long gone when this offer arrives and patronizes with a competitor. At the same time, someone who visits once every three months receives the offer before it is necessary.
The best way to address this dynamic challenge is to rely on the customers’ personal visitation patterns. Even though a range of advanced techniques can be applied, one approach is to consider a basic calculation to determine when customers are expected to make a visit. To do this, one can use a statistical concept called a confidence interval to estimate an expected trip for determining a customer’s trip cycle.
Step 1: Identify the number of days between trips while counting the number of total trips. Take the difference between dates or Time Between Trips (TBT) for each customer. Importantly, this variable is customer-specific and based on individual trip patterns.
Step 2: Average the TBT for each customer. This provides an initial baseline for how often a customer visits. While the average is useful, it ignores the variation in trip frequency.
Step 3: Calculate the standard deviation of TBT’s. The standard deviation accounts for the variation in individual trip patterns.
Step 4: Determine a confidence level for the interval (80%, 90%, 95%, 99%). In other words, how confident are you in capturing the nuances and variations in your customers’ trip patterns? Higher confidence levels mean waiting longer to flag a customer as missing a trip. The confidence levels also provide flexibility in how aggressive marketers want to be with customer retention promotions.
Step 5: Plug the components from Steps 1-4 into an upper-confidence interval formula (McLeod, 2019). In other words, the upper limit of when a customer is likely to return. The result provides a data-driven recommendation for when customers may need to be reengaged.
To demonstrate the metric, consider the visitation patterns of two customers to a local café over a month starting on October 1st. Reviewing the visitation patterns in Table 1, it is apparent that Customer 1 visits more frequently than Customer 2, with some visits occurring back to back. In Step 1, we calculate the TBT for each visit, while counting up each customer’s total visits.
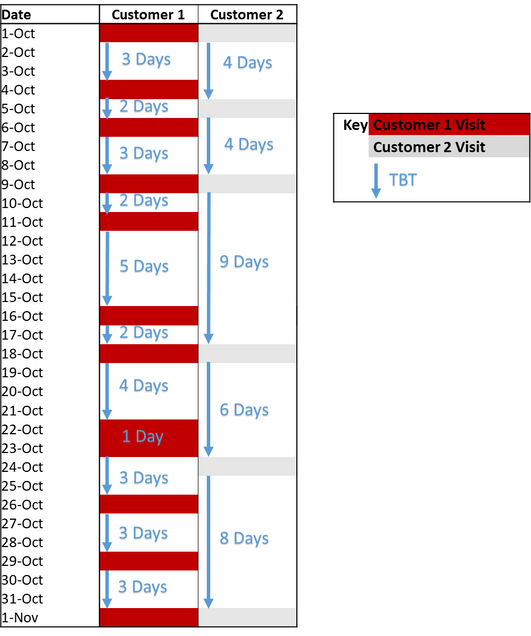
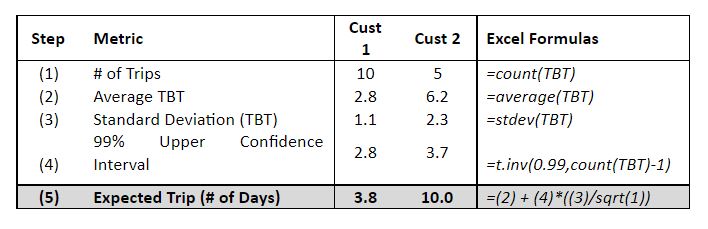
The average time between trips (Step 2) for Customer 1 is 2.8, indicating a visit every 3 days, while Customer 2 visits about once a week (6.2). The standard deviation (Step 3) of TBT also shows Customer 2’s visits are more inconsistent than Customer 1. Let’s assume we want to run a more cautious retention campaign (meaning not target too early), with this in mind, 99% is chosen as the confidence interval and calculated in Step 4. After inputting the figures in Table 2 (Step 5), it is expected that Customer 1 makes a trip every four days (3.8), and Customer 2 visits about every ten days (10.0). Reviewing their trips, Customer 2 never waited more than 10 days to visit the café. Similarly, Customer 1 visits more frequently and their expected visit of 4 days appears reasonable.
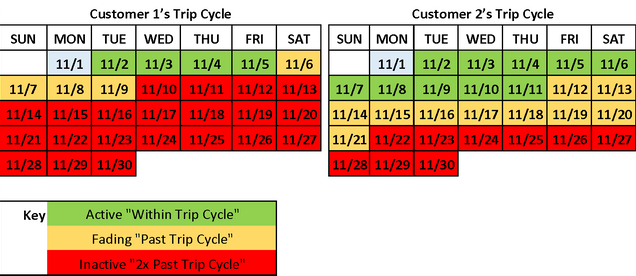
The approach suggests two important findings for marketing managers and analytics professionals. First, the metric is customer-specific and represents their individual behavior. Both customers have different patterns of visit and the metric clearly distinguishes between the two in their upper-confidence interval. Second, it allows for marketing at the customer level. The metric is both easy to implement and provides customization for practical marketing decisions. Consider Figure 1 that displays the expected trip pattern for each customer. In both cases, the last visit of each guest was recorded on November 1. Customer 1 is a loyal guest, in general, Customer 1 visits several times per week and has never missed more than a week based on our data. Using the trip cycle, they are considered active until November 6th (Green). Based on the data, this date would signal that this customer is fading and may suggest a window of opportunity to reengage (Yellow). Similarly, after a week has passed, Customer 1 has missed two trips and may need further re-engagement (Red).
For Customer 2, it is expected they would visit prior to November 11th (Green). However, once this date has passed, Customer 2 is fading, indicating a good time to reengage the customer (Yellow). Eventually, we reach November 22nd (Red). This date indicates that the customer has missed two expected visits and may be considered lost to a competitor. Comparing the expected trips between both customers, by the time November 11th arrives, Customer 1 has missed nearly 2.5 visits, while Customer 2 is still active. The results further demonstrate the ability of the approach to create customer-specific recommendations.
Ultimately, identifying when a customer is inactive is a challenging endeavor for many hospitality organizations. Firms must ignore subjective cutoffs and predetermined beliefs regarding when a customer should receive a promotion, as it is not one size fits all. Hospitality firms should rely on data to create specific promotions that are timely and effective. This article demonstrates a basic approach that may help hospitality organizations further understand their customers’ visitation patterns.
Acknowledgments
Special thanks to Sean (Sangwon) Jung, Ph.D., for the helpful comments.
References