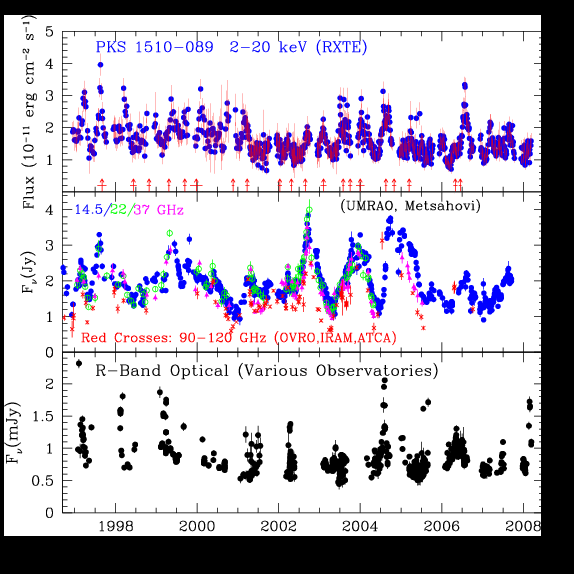
We currently monitor PKS 1510-089 two times per week with RXTE, except for an 8-week period when it is too close to the sun in the sky. Svetlana has made a movie that you can view showing the ejection and motion of superluminal knots and the X-ray, radio, and optical light curves for PKS 1510-089 . Below is a plot of the mulitfrequency light curves, complete up to January 2007. The 2nd plot is the discrete cross-correlation function (as defined by Edelson and Krolik) between the radio (14.5 GHz) and X-ray variations in brightness. PKS 1510-089 has an X-ray flare 1-3 times per year, each lasting about two months. In 1997 and 1998, there was a very good correlation, with the radio variations leading the X-ray by about 2 weeks. The correlation is still present, but weaker, in 1999, with zero time lag (essentially simultaneous variations). In 2000, the correlation disappears. This is probably caused by the jet becoming opaque at 14.5 GHz near the core (the bright feature at the start of the jet). The vertical arrows show times of ejection of apparent superluminal bright spots, with the horizontal bars showing the uncertainty in time of ejection (defined as when the new feature coincided with the core). (Oops, two of the arrows are missing in the middle panel; we'll fix that sometime soon.) The ejections of superluminal components (bright features in the jet) in PKS 1510-089 seen in the sequence of VLBA images (or, if your connection is fast, view the higher-resolution sequence of images) tend to occur near the time of each X-ray flare. We are working on quantifying this. The vertical arrows on the light-curve plot show times of ejection of apparent superluminal bright spots, with the horizontal bars showing the uncertainty in time of ejection (defined as when the new feature coincided with the core). The evolution of the radio jet and its relationship to the X-ray and optical light curves can be visualized in the movie of PKS 1510-089 .

Below is a plot that requires some explanation. It shows the discrete cross-correlation function (as defined by Edelson and Krolik, 1988 Astrophysical Journal, 333, 646) between the 14.5 GHz radio and X-ray variations for each year, using the data shown in the light curve plot above. Now scroll down to the next figure caption

In the figure below, the upper left inset shows the discrete cross-correlation function between the 14.5 GHz radio and X-ray variations over the entire dataset shown in the light curve plot. Notice that the peak of the correlation occurs for the case of the radio leading the X-ray variations by 10-20 days. That means that the brightness changes occur first in the radio, then similar changes are seen in the X-ray light curve. The main plot shows how the correlation changes with time. The numbers give the value of the DCCF at the peak when the data are average over a 1-year period centered on the epoch that corresponds to each point. For example, the first point is for 1997.0 to 1998.0 and has a peak correlation of 0.73 - anything over about 0.5 is a strong correlation given how many data points we have. When the correlation is position, the radio variations happen first and when negative, the X-rays lead the radio. Why the change in the correlation, which moves into X-ray leads territory and gets pretty weak in 2000? It may be connected with the change we see in the direction of the jet [shown in the upper right inset, with -90 degrees being due west and 0 degrees due north, so -45 degrees is NW] when we observe the quasar with the VLBA. We think that when the jet points farthest to the south, it becomes more opaque at 14.5 GHz, the radio frequency used in the correlation plot. If so, then there should also be a delay between flares at 22 and 37 GHz, where the jet is more transparent, and 14.5 GHz, and also a delay between the ejection of a superluminal knot and the flare at 14.5 GHz. The light curve plot seems to support this, but the data are not as frequently sampled as we'd like. So, stay tuned as we continue to observe this fascinating quasar.

Return to Blazar Group X-ray page