Imagine looking at Boston as a living, breathing organism. The city consumes energy in the form of resources and services, processes them into gross domestic product, and produces waste. Some of that waste, the carbon dioxide from industrial smokestacks, vehicle exhaust systems, buildings, and even people, contributes to global warming.
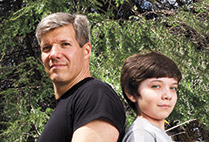
Now imagine tracing that carbon. That’s what Lucy Hutyra, Nathan Phillips, and a team of researchers plan to do, in an effort to understand where Boston’s carbon emissions come from, how carbon is stored, and what the net balance of these activities means for the future of the city—and the planet.
Carbon is “like the life blood that’s flowing through the system,” says Phillips, a College of Arts & Sciences professor of earth and environment. “Understanding cities and their overall carbon emissions is absolutely crucial to understanding the global carbon cycle and global climate change.”
Hutyra, a CAS assistant professor of earth and environment, says nearly 70 percent of global carbon dioxide emissions comes from cities, which cover only 3 percent of the Earth’s surface but are home to more than half of the world’s population.
One way involves atmospheric carbon. Phillips and other researchers established six observation towers in Massachusetts: one in Nahant, one in Worcester, one in Harvard Forest, in Petersham, and three in Boston. They rigged each with an instrument that records carbon dioxide levels throughout the day.
They found that the levels reflect human activity and the seasons, registering higher during rush hour traffic and peak winter heating months and lower during weekends and summer vacation times. Not surprisingly, readings in rural sites are consistently lower than those at urban sites.
Hutyra’s contribution to ULTRA overlaps with her study, funded by an NSF CAREER Award, of how differently plants behave in urban and rural environments. Boston is a relatively green city, with about 28 percent canopy cover, she says. That’s important because trees remove carbon dioxide from the air through photosynthesis and they provide shade, which reduces the urban heat island effect and air conditioning’s energy demand.
Since 2010, Hutyra, postdoctoral associate Steve Raciti, and graduate assistants have gone into the urban forest (which could mean two elms along the side of a building) to measure tree circumferences and take soil samples. Their findings, published last year in the journal Ecological Applications, showed that carbon concentrations in urban vegetation and soil were higher in a city’s forested regions than in residential and other developed land areas. Hutyra thinks urban trees are adapting—and possibly growing faster—in this carbon dioxide–rich environment.
Soil covered by pavement or concrete doesn’t fare as well. Raciti, Hutyra, and Adrien Finzi, a CAS professor of biology, wrote last year in Environmental Pollution that soil under impervious surfaces in New York City contained 66 percent less carbon and 95 percent less nitrogen than that found in exposed soil. “The soil was also for many purposes dead,” says Hutyra. “There was no microbial activity remaining.”
Knowing how much carbon is stored in trees and the soil will help determine the amount released into the atmosphere through land development or deforestation.
That’s where remote sensing comes in handy. ULTRA collaborators Mark Friedl, a CAS professor of earth and environment, and Curtis Woodcock, a CAS professor and chair of earth and environment, are using satellite imagery to reconstruct the way land cover has changed around Boston since the 1980s. Deforestation results in “a net release of carbon to the atmosphere,” Friedl says. “Depending on the age and size of trees in a forest, it could be substantial.” The reverse is true as forests flourish in previously developed spaces.
Friedl also uses remote sensing to track seasonal change. As spring arrives earlier and fall later, plants have a longer growing season and absorb more carbon dioxide. This change is visible through satellite imagery, which Friedl double-checks through a system of cameras that take daily pictures of places like Storrow Drive and Boston Common. In 2010, he was stunned to see how greatly the urban heat island effect, and resulting longer growing season, affected city trees. Those in Boston Common leafed out nearly three weeks before those in Harvard Forest, just 70 miles to the west.
“This would be an ivory tower exercise,” Phillips says, “if it didn’t have an applied goal. And that applied goal is to increase sustainability in Boston and in other cities as well.”
Winter is getting warmer, spring is coming earlier, and plants are enjoying an extended growing season in northern areas. But that is not good news.
“It’s the initial gold rush,” says Ranga Myneni, a College of Arts & Sciences professor of earth and environment, but what will follow will not be pleasant. As vegetation flourishes, it could draw down the water supply, bringing on drought, insect infestations, and forest fires. What was once green, lush land could become… Continue reading


Related Stories
Good News and Bad News about Forest Fragmentation
New England forest edges absorb more carbon but suffer more heat stress
Montreal Protocol Has Slowed Global Warming
BU-aided research: humans can retard climate change
A New Map for Greenhouse Gas
Novel tool can help cities meet climate change goals
Post Your Comment