E-Portfolios and Assessment
The rising cost of an undergraduate degree has led many to question if a college education is worth the price. How much do students learn and improve in their four years of college? How can we prove that undergraduate programs are helping students to progress? BU College of General Studies (CGS) assesses students using e-Portfolios and a rubric designed by the College, and the results show CGS above its peers in helping students to build critical thinking, analytical, and communication skills.
History
E-Portfolios: Thanks to a grant from the Davis Educational Foundation, CGS launched its e-Portfolio initiative in 2008—the largest e-Portfolio pilot at Boston University. In 2008, CGS required all freshmen to set up e-Portfolios for archiving their formal and informal academic work and reflections. In 2009, CGS expanded e-Portfolios to sophomore courses and began working with faculty to develop a rubric to assess student’s skills.
Rubric: Based on the Association of American Colleges and Universities’ VALUE rubric, the CGS rubric measures student mastery in seven areas: written and oral communication; analyzing and documenting information; awareness of historic and cultural context; awareness of rhetorical and aesthetic conventions; critical thinking and perspective taking; integrative and applied learning; quantitative methods. In 2011, CGS began to assess students’ progress using the rubric.
Assessment Model
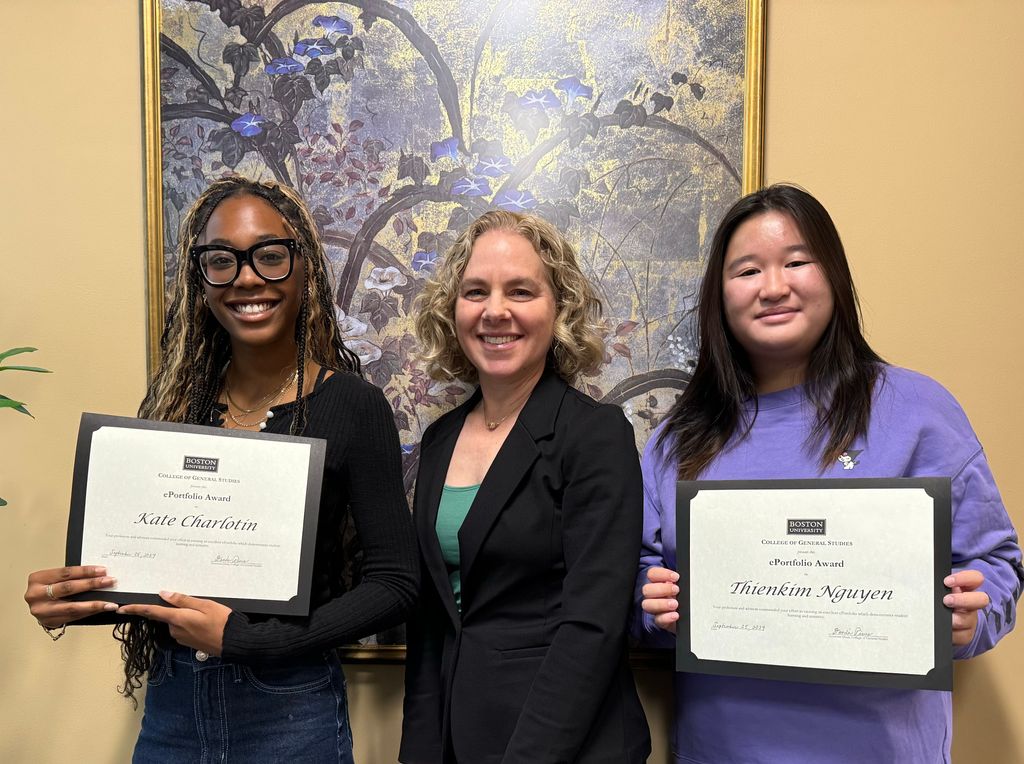
Self-Assessment: CGS uses the rubric and e-Portfolio to encourage students to think about their own development as thinkers and communicators. At the end of their freshman and sophomore years, students use the rubric to assess their own learning and reflect on their work. CGS also gives awards for outstanding e-Portfolios each year.
Faculty Assessment: During the academic year, a committee of 11 CGS faculty assesses a random sample of over 100 CGS students. Using e-Portfolio to access and review a student’s complete body of work, faculty members measure student’s competency in each of the seven rubric areas. The assessments provide quantitative and qualitative data, offering a richer and more nuanced picture of student progress than assessment tests could.
E-Portfolio Examples
Results
Results suggest that student improvement in our program is above the national average. Several extensive studies show that student improvement averages 7% in the first two years of college studies. CGS assessment averages in 2015 show percentile-point gains in the range of 22% to 32%, and students make progress in all areas the rubric measures.
Sharing Our Learning
As assessment and learning outcomes become a higher priority in higher education, CGS faculty have shared their insights within BU and across the world at:
- Association of American Colleges and Universities meetings
- Association for Authentic, Experiential and Evidence-Based Learning meetings
- Association for General and Liberal Studies
- Association for Educational Communications and Technology
- New York University’s Office of Global Services
- Effat University in Jeddah, Saudi Arabia
- Connect to Learning project
- Pontificia Universidad Católica de Chile
- State University of New York at Buffalo
- General education conference held at Universidad Diego Portales in Santiago, Chile
- General education symposium held in Seoul, South Korea
- Forums within BU, sponsored by Global Programs and Office of the Provost
News and Media
- Boston University Digital Learning and Innovation: E-Portfolio Assessments to Deepen Learning
- BUniverse: Assessing Archived Artifacts in e-Portfolio
- CGS Dean Shares General Education Insights with a Global Audience
- Opportunity Meets Ambition: CGS shares its know-how with a women’s university in Saudi Arabia
- Working Together: CGS faculty incorporate quantitative reasoning in interdisciplinary ways
