Lighting Up: China’s Arrival in Brazil’s Electricity Sector
By Pedro Henrique Batista Barbosa
Since 2010, when the first Chinese investment in Brazil’s electricity sector happened, China’s presence in the Brazilian electricity sector has expanded considerably in a relatively short period of time.
Through a combination of mergers and acquisitions (M&A, or brownfield investments) and greenfield foreign direct investments (GFDI) and benefiting from an ongoing process of internationalization of Brazil’s electric sector, Chinese electric power companies became the leading foreign players operating in the country, displacing other traditional external and internal actors. As of 2019, they represented 10 percent, 12 percent, and 12 percent of Brazil’s generation, transmission, and distribution segments, respectively; therefore, ranking second, third and fourth places in terms of nationalities’ percentage.
Relying on primary data, provided by the Brazilian Electricity Regulatory Agency, mapping changes in the ownership structure of Brazil’s 8,728 power plants in operation in 2019, a new working paper offers the first estimates of Chinese-controlled power generation installed capacity, kilometers of transmission lines, and number of consumers in Brazil, their evolution over time, and their percentage of the whole local system. The research aims at analyzing China’s penetration in the country’s electric sector in each of its three segments and different sources of energy.
Resorting to a wider range of sources and databases, from public and private sectors, the working paper offers its own estimates on Chinese total investments in Brazil’s electric segment and debates some of its features, such as mode of entry, preferred sources of energy and sectors, geographical distribution, among others.
Moreover, the working paper equally debates the activities of Chinese policy banks, commercial banks and regional funds in the Brazil, mostly giving support to power electric companies, but, in some cases, remarkably, operating as investors, as well. Lastly, reasons for this booming bilateral relationship are discussed.
Capital invested
This study has identified at least 14 Chinese electric companies that were or are investing or operating in Brazil, including State Grid, China Three Gorges (CTG), China General Nuclear Power (CGN) and State Power Investment Corporation (SPIC). These and other firms have invested and were involved in construction projects in Brazil that amount to $36.5 billion until 2019.
Figure 1: Chinese FDI/Construction Projects Figure 2: Types of Investment
(US$ billion) (2005-19)


Source: see working paper for full source details.
The inaugural project in Brazil happened in 2005, but it was only after 2010 that investments started an upwards trend.
From 2015 on, there was a significant increase in numbers, with peaks in 2015 ($6.5 billion) and 2017 ($15.6 billion), mainly due to deals pioneered by State Grid and CTG. In 2015, the former won alone the bid for the second transmission line of the Belo Monte dam, a project that demanded roughly $1.78 billion. In the same year, CTG spent $3.7 billion to buy Jupia and Ilha Solteira dams and became the country’s second biggest electricity generator. In 2017, State Grid disbursed around $12.2 billion to acquire the Companhia Paulista de Forca e Luz (CPFL), one of the major players in the country’s electric sector.
In terms of mode of entry in Brazil, Chinese companies mostly resorted to M&A, in contrast to greenfield investments. These projects represented 76 percent of the total, or $27.6 billion. Except in 2013, 2014 and 2018, the amount of brownfield deals was higher than greenfield ones in all years. The highest amount was spent in 2015, 2017 and 2019.
Greenfield investments amounted to 20 percent of the total, or $7.4 billion. The participation of State Grid in the Belo Monte dam’s two transmission lines’ auctions were the most prominent projects. Lastly, engineering projects and other services provided by Chinese companies amounted to four percent of all capital disbursed, or approximately $1.5 billion.
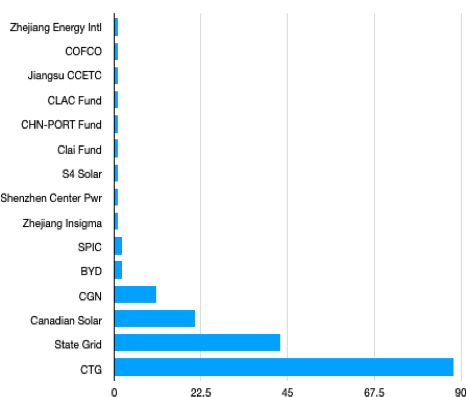
Figure 3: Chinese FDI per company(US$)
(US$ billion)
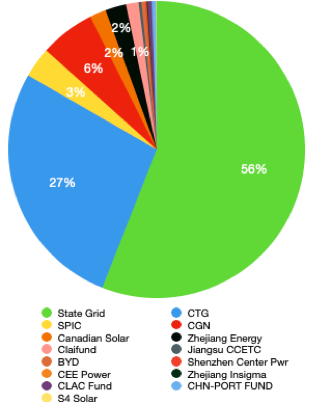
Figure 4: Number of Projects/Deals (2000-2019)
Source: see working paper for full source details.
Because of the CPFL and Belo Monte lines’ deals, State Grid is the Chinese company that invested the most in Brazil, representing 56 percent of the total power sector investment from China, followed by CTG with 27 percent, CGN with 6 percent and SPC with 3 percent.
Considering only FDI projects, there were 176 transactions and CTG has the greatest number of deals, since it is indirectly present in Brazil since the end of 2011, when EDP was acquired in Portugal. EDP has been consistently investing in the South American country since then. Putting the numbers invested by these firms in Brazil in comparison with their global investments, according to FDI Intelligence data for greenfield and DeaLogic for brownfield deals, roughly half of State Grid overseas investments went to Brazil, a percentage that mounts to 60 percent in the case of CTG, 31 percent for CGN and 17 percent to SPIC.
Figure 5: Chinese FDI/Construction Projects per State (2005-2019)

Source: see working paper for full source details.
In terms of the geographical distribution of FDI and construction projects, Chinese firms are active in all Brazil’s five macro-regions, 22 states in total. The Southeast received 66 percent of the total invested, especially because Sao Paulo’s (SP) was the major destination of funds. The Northeast came in second with 11 percent, followed by the Central-West with 10 percent, the South with 7 percent and the North with 6 percent.
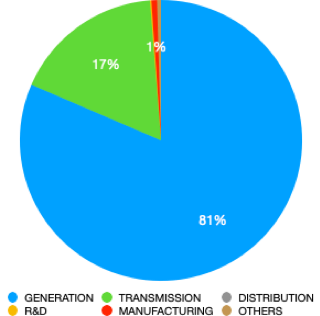
Figure 6: Chinese FDI/Construction Projects per Sector (US$ billion)

Source: see working paper for full source details.
In terms of energy investment sectors, Chinese firms have invested more in generation, which encompassed 81 percent of the total or roughly $29.7 billion. Almost all deals happened in the last six years of the period, with the highest numbers in 2015, 2017 and 2019, because of CTG’s, State Grid’s and CGN’s brownfield transactions, respectively. CGN only arrived in Brazil in 2019.
Figure 7: Chinese FDI/Services per Source of Energy (US$ billion, generation)

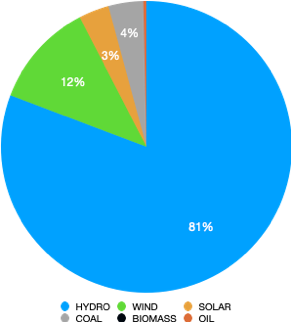
Source: see working paper for full source details.
Hydropower received 81 percent of all investments. Wind power came in a distant second place, with 12 percent of the total, mainly due to projects from CPFL Renovaveis, CGN and EDPR. Coal power received 4 percent of the funds, and solar, 3 percent.
Power Generation
In the end of 2019, these companies owned or partially owned 304 power plants in Brazil, which totaled 16,736 MW. This is close to 10 percent of the national system.
In terms of the technology mix, 70 percent of Chinese electricity capacity in Brazil in 2019 was in hydropower (11798 MW). Wind power took up 17 percent (2888 MW), and biomass, solar, oil, and coal comprised 5 percent (759 MW), 4 percent (680 MW), 3 percent (532 MW) and 1 percent (79 MW), respectively. This distribution reflects the pattern of Chinese FDI in Brazil, which were concentrated in hydro and wind plants.
Considering that the majority of the Chinese companies’ installed capacity is in renewable energy, the case of Brazil illustrates that Chinese players focused their energy investments where the host country has a natural advantage or an abundance of resources. Comparatively, most of Chinese overseas installed capacity is on coal power, according to China’s Global Power Database from the Global Development Policy Center.
Figure 8: Chinese Companies’ Installed Capacity per Source of Energy in Brazil (GW)
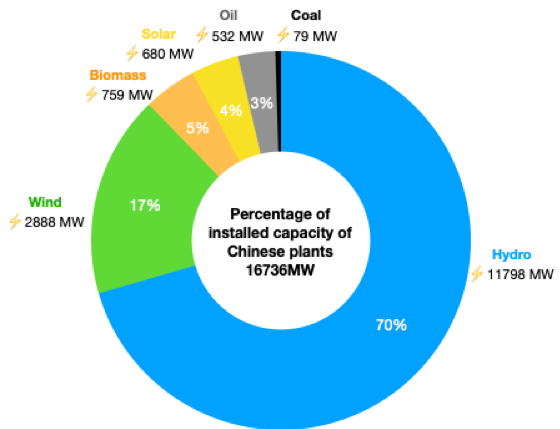
Source: Agencia Nacional de Energia Eletrica (ANEEL).
The Chinese owned 304 power plants are located in 17 states and are present in all five regions of the country. The Northeast concentrated the majority of the plants (160), and the Southeast, the highest capacity (10 GW). Individually speaking, the northeastern state of Rio Grande do Norte (RN) had the top number of plants (79), and the Southeastern Sao Paulo (SP), the biggest generation capacity (7.9 GW).
Figure 9: Geographical Distribution of Plants and Installed Capacity
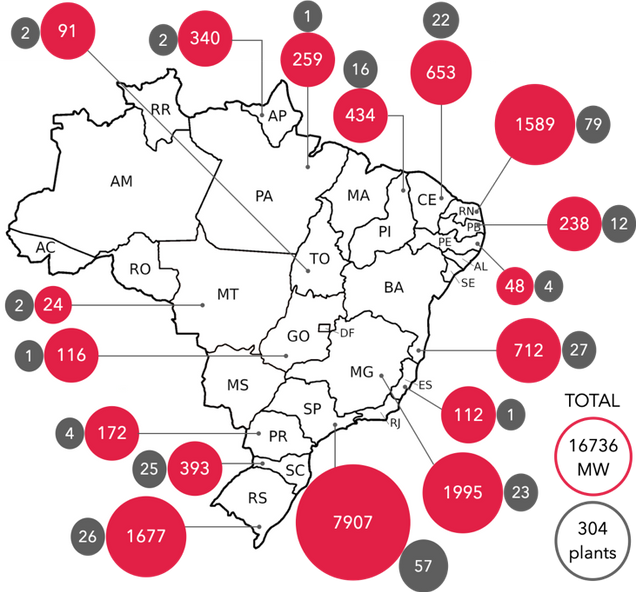
Source: Agencia Nacional de Energia Eletrica (ANEEL).
On the company level, CTG accumulated more generation capacity over the years (6.5 GW) and is Brazil’s second biggest electricity generator. It has power plants in 12 states. Its energy technology matrix is concentrated in hydropower. State Grid has 4.3 GW scattered among 123 units in ten states. All this capacity belongs to CPFL, whose portfolio is diversified, with assets in hydro, wind, biomass, oil and some solar power. Chinese investment funds, such as China-LAC Industrial Cooperation Investment Fund (CLAI), China-LAC Cooperation Fund (CLAC) and the China-Portuguese Speaking Countries Fund have power generation stakes, especially CLAI, which has partnered with CTG in several dams.\
Figure 10: Installed Capacity per Source and Number of Units
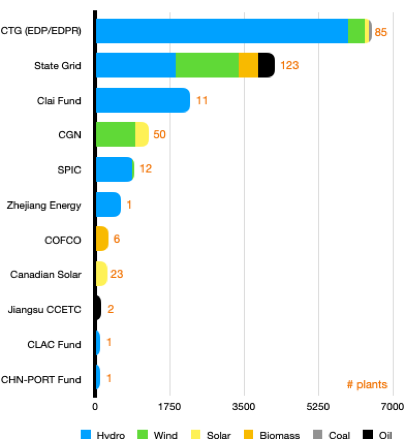
Figure 11: Numbers of Generation Units per State
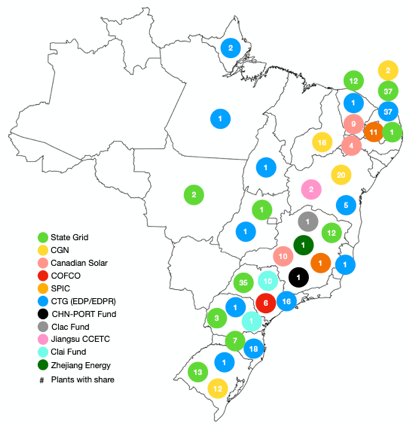
Source: Agencia Nacional de Energia Eletrica (ANEEL).
* The number of units refers to the units where each company have stakes; in some plants, more than one Chinese company have shares.
Chinese companies have hydropower assets in all regions, except the Northeast, where the favorable natural endowment made wind and solar projects dominate. Besides the Northeast, there are wind and solar plants in the South and Southeast. Biomass power plants are mostly concentrated in Sao Paulo. Oil-fueled power plants are mainly in the Northeast. Lastly, coal plants are only present in Ceara.
Some states’ electricity production has high contribution from Chinese companies, such as Amapa (34 percent), Rio Grande do Sul (13 percent) and Paraiba (11 percent). However, in general, shares of Chinese companies are small. Despite the fact that Sao Paulo concentrated most of Chinese investments, China’s participation in this state’s total installed capacity is minimal (0.1 percent). However, 48 percent of the state’s hydro generation is in the hands of Chinese actors. In Amapa, Rio Grande do Sul, and Espirito Santo, 36 percent, 23 percent, and 20 percent of the hydropower capacity is administered by Chinese companies, respectively.
Figure 12: Geographical Distribution of Chinese Installed Capacity per Source (MW)
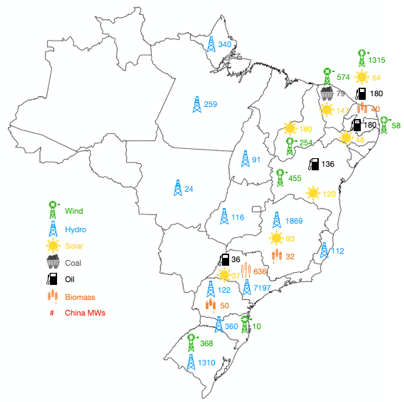
Figure 13: Percentage of Chinese Installed Capacity per Source and State
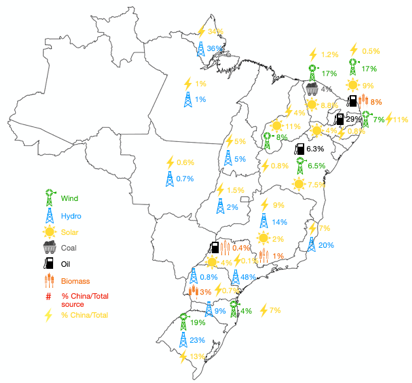
Source: Agencia Nacional de Energia Eletrica (ANEEL).
Positioning Chinese investment in Brazil from a global perspective, until 2018, at least 63 Chinese energy firms have full or partial asset ownership in up to 186.5 GW of overseas capacity, distributed through 777 plants.
Asia by far concentrates most of these Chinese power generation assets, with Latin America coming in a distant second place. Individually, Brazil is the main recipient. By the end of 2018, CGN accumulatively invested in a total of 19,740 MW, whereas CTG 16,718 MW, SPIC 9,178 MW and State Grid 7,409 MW, according to China’s Global Power Database from GDPC. Comparing with their assets in Brazil until that year, the South American country represented roughly 6 percent, 39 percent, 10 percent and 57 percent of their overseas possessions respectively.
Transmission
The history of Chinese investments in Brazil’s transmission sector is entangled with State Grid’s expansion and experience there. As the largest electric power company in the world, it accounts for 95 percent of the $6.3 billion that have been invested by Chinese electric firms in the South American giant as of 2019.
As a consequence, 87 percent of the 16,776 km of Chinese-owned transmission lines belong to State Grid. CTG and Zhejiang Insigma United Engineering are the other active Chinese players. Their assets altogether account for almost 12 percent of the total length of transmission lines in Brazil, of which State Grid alone owns more than 10 percent.
Figure 14: Locations of Transmission Lines per Company
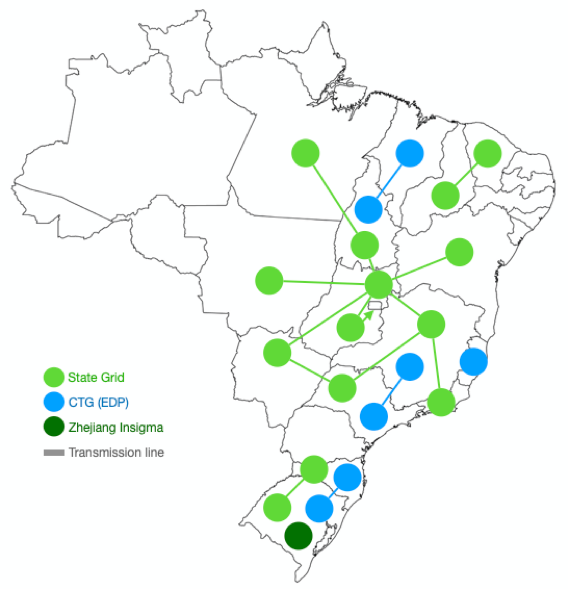
Source: Agencia Nacional de Energia Eletrica (ANEEL).
Undoubtedly, State Grid’s two landmarks in Brazil are the two lines of the Belo Monte dam, with more than 4600 km of ultra-high voltage (UHV, 800kV) lines crossing the country from the North to the Southeast, where the main consumer market is located.
Chinese firms are present in all five regions, in 16 states. State Grid is the only one active in all regions. It has transmission lines crossing the country in different directions and with different voltages. CTG/EDP’s transmission lines are more concentrated in the Southern states, and Zhejiang Insigma possesses only one project in Rio Grande do Sul.
Distribution
Chinese companies’ arrival in Brazil’s electricity distribution sector coincides with the generation segment. CTG and State Grid are the only Chinese firms with investments in distribution. The 2011 CTG’s investment in EDP gave the former indirect assets in two local concessionaires. State Grid’s presence started in 2017, with the acquisition of the Sao Paulo-based CPFL, which is historically one of the biggest electricity providers. With CPFL’s acquisition, the number of consumer units attended by Chinese firms expanded substantially.
Considering each Chinese company’s shares in their local concessionaires, State Grid and CTG have the equivalent of 114 and 12 million consumer units respectively, dispersed in four different states. They represented in 2019 roughly 12 percent of Brazil’s distribution sector’s consumer units. Separately, the former accounted for 11 percent, and the latter, one percent.
Figure 15: Chinese Firms’ Percentage in the Number of Consumer Units per State*
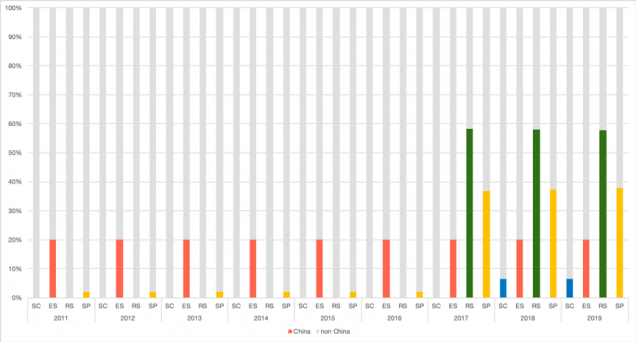
Source: Agencia Nacional de Energia Eletrica (ANEEL).
*SC, ES, RS, and SP refer to the states of Santa Catarina, Espirito Santo, Rio Grande do Sul, and Sao Paulo, respectively.
In each of these four states, Chinese percentage of the local distribution sector varied over time.
For instance, participation in Espirito Santo was around 20 percent, a percentage that remained stable over the years. In Sao Paulo, Chinese participation started small – roughly two percent until 2016, but augmented considerably after 2017, ending 2019 with 38 percent. The 2017 turning point was CPFL’s acquisition. In Santa Catarina, Chinese participation started in 2018, when EDP partially bought part of Celesc. Finally, in Rio Grande do Sul, participation only started in 2017 and has remained 58 percent until 2019.
Conclusion
This work provides a broad and thorough portrait of the Chinese presence in Brazil’s electricity sector, a measurement of how deep China has penetrated in each of the segments after years of constant investments. It sheds light on how Chinese companies have contributed to recent development and overall expansion of Brazil’s electricity sector over the last few years. Hitherto, this phenomenon might have been out of sight to the general public. This research also might indicate future trends in investments, considering the recent upsurge in solar and wind projects.
Moreover, the research presented here can be a useful tool for sectoral researchers on a state, local, or project level. It provides a country case study, where China is involved predominantly in renewable energy, in contrast to the coal-dominant portfolio of China’s overseas investment in the power sector, corroborating previous findings in the literature that factors such as local resource endowment, path dependence, and relations with China are important drivers of China’s investment pattern in the power sector. The findings may equally be valuable to investors and business entrepreneurs endeavoring to enter the sector or expand electricity assets in the Brazilian market. The work may also be a valuable device for Brazilian and Chinese policy and decision-makers from both sides, who constantly need precise information to craft development strategies for their countries. Ultimately, but not less important, this research can serve as a contribution to improving the understanding on important topics of Sino-Brazilian relations.
Read the Full Working Paper