How Green and Inclusive is China’s Overseas Development Finance? A New Global Outlook

By Hongbo Yang and Rebecca Ray
China is now the world’s largest source of bilateral development finance and will likely continue to play a prominent role in providing sovereign loans to developing countries through its multi-billion-dollar Belt and Road Initiative.
This substantial increase in global development finance could potentially bring major benefits to the world economy. The World Bank estimates China’s overseas lending could lead to an increase in recipient countries of up to 3.4 percent of GDP. But the huge influx of Chinese capital into the developing countries has raised major concerns about the social and environmental risks arising from the financed projects – especially regarding biodiversity loss and encroachment on Indigenous peoples’ lands.
However, the social and environmental risks implicit in China’s overseas development finance have been largely unknown, due to the lack of high-resolution spatial data to track the exact locations of China’s overseas lending. This lack of data has compromised the capacity of scientists, decision makers and stakeholders to identify the areas to anticipate and mitigate environmental and social risks from China-financed development projects.
In December 2020, the Boston University Global Development Policy Center published the China’s Overseas Development Finance (CODF) Database, which tracks overseas sovereign loans made by China’s two major policy banks, the China Development Bank (CDB) and the China Export-Import Bank (CHEXIM), from 2008-2019. This database offers the first precisely geolocated record of CDB and CHEXIM’s overseas sovereign finance operations, with each project identified by its exact footprint, as Figure 1 illustrates below. Database users can access a publicly available record of each project’s detail, including geospatial data of project locations for points (such as buildings), lines (such as roads and power lines) and polygons (such as reservoirs or mines).
Figure 1: Examples of Project Footprints: Points (left), Lines (center) and Polygons (right)

The findings and methodology behind the underlying dataset are the subject of two new journal articles. The first, published in Nature’s Scientific Data details how the CODF dataset enables better understanding of the economic, social and environmental effects of China’s overseas development finance. The second article, published in Nature Ecology & Evolution (Nature E&E), was coauthored with scientists at the Boston University Department of Earth and Environment. Leveraging the CODF dataset, the Nature E&E article further assesses the scale and distribution of the risks from China-financed projects to key lands areas that are essential to the integrity of global biodiversity and the well-being of Indigenous communities.
Main findings on the scale and distribution of Chinese financed projects:
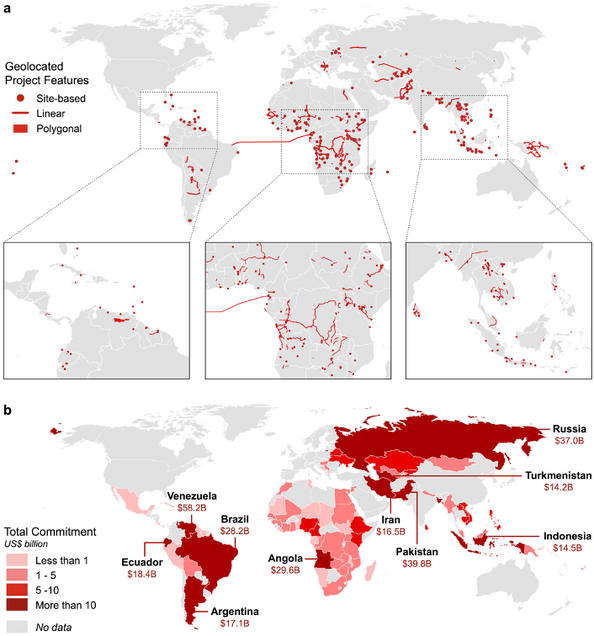
- The CODF dataset verified and mapped 859 international loans made by CDB and CHEXIM from 2008 to 2019, totaling $462 billion, which is just $5 billion short of the World Bank’s sovereign commitments made in the same period.
- Although the finance provided spans 93 countries, 60 percent of the lending went to just ten countries: Venezuela, Pakistan, Russia, Brazil, Angola, Ecuador, Argentina, Indonesia, Iran and Turkmenistan.
- 72 percent of China’s finance commitments occurred in the transport, extraction and energy sectors. Projects in these infrastructure sectors are often known to pose relatively high risks to ecosystems and local communities.
Figure 2: Locations of Chinese Development Finance Projects, 2008-2019

Main findings on the risks to global biodiversity and Indigenous peoples’ lands:
Acknowledging the benefits China’s overseas development finance may bring, there is also a concerning potential for significant risks to global biodiversity and Indigenous communities.
Threatened species are priorities of global biodiversity conservation. Critical habitats and protected areas provide important sanctuaries for threatened and other species of high biodiversity conservation significance. Ecosystem disruptions (e.g., forest loss) and land use changes (e.g., agriculture expansion) associated with development projects are a common threat to endangered species and land areas that are critical habitats or protected areas. Due to the lack of universal recognition and protection of Indigenous peoples’ rights, development projects within or surrounding Indigenous lands may have been implemented without Indigenous communities’ consent, leading to social, economic and political conflicts.
While the risks to biodiversity and Indigenous peoples’ lands span across the world, our assessment highlights risk hotspots based on projects’ proximity to areas of high importance to biodiversity and Indigenous communities:
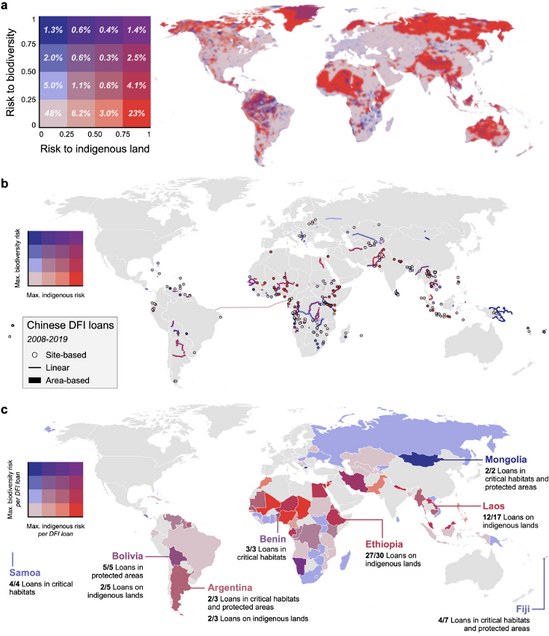
- 63 percent of Chinese financed projects overlap with critical habitats, protected areas, or Indigenous lands, with up to 24 percent of the world’s threatened birds, mammals, reptiles and amphibians potentially impacted by the projects.
- China-financed projects present high risks to biodiversity and Indigenous lands, primarily in South America, Central Africa and Southeast Asia.
- Chinese financed projects have the highest rate of overlap with indigenous peoples’ lands in three countries: Ethiopia, Laos and Argentina. More than 70 percent of China’s loans overlap with Indigenous peoples’ lands in each of those countries.
- All the projects in Benin, Bolivia and Mongolia have some overlap with critical habitats and protected areas.
Figure 3: Global Distribution of the Risks to Biodiversity and Indigenous Lands from Chinese Development Finance Projects

Main findings: How the risk profile of Chinese projects compares to those of the World Bank
Compared to China’s policy banks, the World Bank has more transparency, public engagement and stringent safeguards for their lending to mitigate potential risks of environmental degradation and social conflicts. This differs from China’s approach of deferring to host countries’ social and environmental standards for development projects. Our research found these two different approaches to environmental and social risk management are associated with significant differences in the projects that are approved, and the risk implicit in where these projects are located:
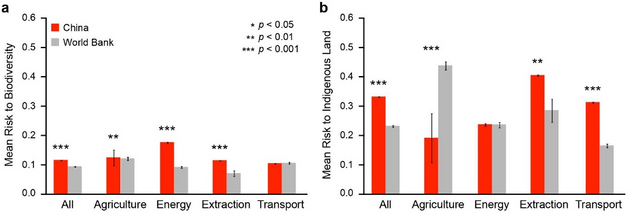
- On average, projects financed by China’s policy banks present greater risks to biodiversity than projects financed by the World Bank, particularly in the energy sector.
- Except in the transport sector, the biodiversity risk associated with projects financed by China’s policy banks is significantly higher than the World Bank’s.
- The overall risks to Indigenous peoples’ lands are also greater across China’s project sites, though variations exist across different sectors. Risks to Indigenous lands from China’s projects are higher in the extraction and transportation sectors compared to the World Bank but are lower in the agriculture sector. In the energy sector, the risks to Indigenous peoples’ land posed by projects financed by China’s policy banks and the World Bank are similar.
Figure 4: Comparison of Integrated Risks to Biodiversity, China and the World Bank

How China can lead the way in providing sustainable development finance
As the world’s largest bilateral lender, China’s approach to environmental and social risk management has global ramifications. Its process of strengthening scrutiny for its international lending operations will set an example for other lenders around the world.
In October 2021, China will host the Conference of the Parties to the Convention on Biological Diversity and could pledge to align its overseas development finance with the new global biodiversity goals for the coming decade. While recognizing host countries’ standards, China’s policy banks may consider working more closely with the borrowing countries to establish robust due diligence, higher standards and better risk mitigation associated with their loans. Towards that end, China may leverage its successful domestic environmental protection efforts, and extend that experience to its overseas lending. For example, China recently developed a technical protocol to identify ‘ecological redline’ areas of great ecological importance for protection across its vast territory. Similar techniques could be extended to its overseas financing to identify areas that should be avoided in new development projects.
After four decades of exceptional economic growth, China has become one of the largest sources for global development finance. This funding has significant potential to facilitate the economic recovery from the COVID-19 and mitigate climate crises. If Chinese finance institutions manage to align their finance with social and environmental sustainability goals, the world would stand a better chance of building a sustainable future.
Hongbo Yang is a former Postdoctoral Fellow with the Boston University Global Development Policy Center.
Read the Journal Article in Nature Ecology & Evolution