How Chinese Loans to Africa Changed During the COVID-19 Pandemic

By Oyintarelado (Tarela) Moses and Jyhjong Hwang
The 2022 update to the Chinese Loans to Africa (CLA) Database, managed by the Boston University Global Development Policy (GDP) Center, recorded 11 new loan commitments worth $1.9 billion from Chinese lenders to African government borrowers in 2020.
This low amount, not seen since the mid-2000s, is down 77 percent from 2019 volumes, when Chinese lenders signed 32 loan agreements worth $8.2 billion. Overall, the CLA Database estimates Chinese financiers signed 1,188 loan commitments worth $160 billion with 49 African governments, their state-owned enterprises and five regional multilateral organizations between 2000 and 2020.
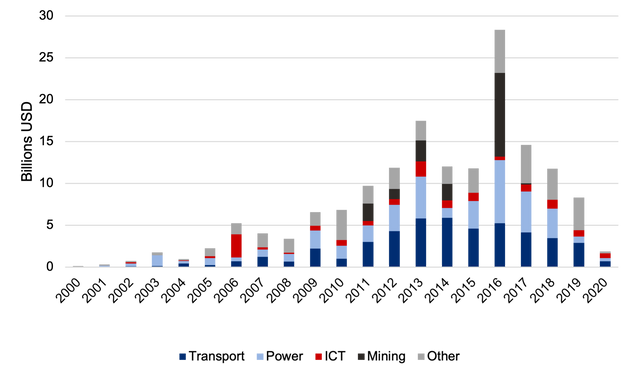
Figure 1: Chinese Loans to Africa, 2000-2020

The CLA Database is an interactive data project tracking loan commitments from Chinese policy and commercial banks, government entities, companies and other financiers to African governments and state-owned enterprises. In contrast to other databases managed by the GDP Center, the CLA Database tracks loan commitments from Chinese commercial lenders and other government lenders beyond China’s policy banks – the China Development Bank (CDB) and Export-Import Bank of China (CHEXIM). Starting in 2007, researchers have collected, cleaned and analyzed publicly available data to create a database on Chinese lending to Africa. The data sources include official government documents, contractor websites, fieldwork, interviews and media sources.
A new policy brief provides detailed insight into the low lending volumes of Chinese loans to Africa in 2020.
As seen in Figure 1, Chinese loans to Africa peaked in 2016 and subsequently decreased. If Angola is excluded as an outlier, loans to the rest of Africa peaked even earlier, in 2013. Given these trends and the effects of the COVID-19 pandemic on African borrowers and Chinese lenders, the striking reduction in 2020 loan amounts is not surprising. The pandemic impacted many African economies by restricting the fiscal space to service debts which, coupled with over-borrowing after the debt relief initiatives from the early 2000s, likely impacted the willingness to borrow from China. Chinese lending capacity may have also played a role in this reduction, as Chinese policy bank lending has pulled back in other regions likely due to cautionary lending practices, an attention to Chinese domestic priorities during the pandemic, travel restrictions and lockdowns and a shift to focus more on debt restructuring for host countries.
Despite decreased lending in the region, 2020 data displays insightful findings. The $1.9 billion of Chinese loan commitments to Africa in 2020 were distributed across 11 projects in Burkina Faso, Democratic Republic of Congo, Ghana, Lesotho, Madagascar, Mozambique, Rwanda and Uganda. The regional bank African Export-Import Bank also received one of the loans. These loans were committed to five information and communications technology (ICT) projects, three power projects, two transport projects and one banking project. Distinct from previous years where the transport and power sectors dominated, loan amounts to the ICT sector pulled ahead, receiving $568 million worth of loans in 2020, as shown in Figure 2. CHEXIM signed commitments for eight of the 11 projects, continuing their role as the top Chinese lender to Africa from 2000-2020. Industrial and Commercial Bank of China (ICBC), Bank of China (BoC) and Dongfang Electric International Corporation signed commitments for the other three projects. CDB provided no new loans to Africa in 2020.
Figure 2: Chinese Loans to Africa by Sectors, 2020

The 2000-2020 loan data also demonstrates the diversity of African borrowers. From 2000-2020, Angola, Ethiopia, Zambia, Kenya, Egypt, Nigeria, Cameroon, South Africa, Republic of Congo and Ghana were the top ten recipients of Chinese loans, accounting for 71 percent of all commitments, represented in Figure 3. Top recipients of Chinese loan commitments in Africa represent a range of characteristics: from the democratic South Africa to the authoritarian Republic of Congo; from middle-income Egypt to the low-income Democratic Republic of Congo (DRC), from the resource-rich Angola to the resource-poor Ethiopia. This diversity underscores the willingness of Chinese lenders to respond to host country demand in Africa over the years, regardless of income level or regime type.
Figure 3: Chinese Loan Values to Africa by Country, 2000-2020

Chinese lenders in Africa range from the policy and commercial banks to other government institutions and Chinese companies. CHEXIM and CDB contributed 54 percent of all commitments worth $87 billion and 24 percent of all commitments worth $39 billion, respectively. Together, these two policy banks account for $126 billion, about 79 percent of total loan commitments since 2000. The other 21 percent of total loan commitments is covered by a range of commercial Chinese banks such as ICBC, BoC and China Construction Bank (CCB), other sources of Chinese government financing such as zero-interest loans from the China International Development Cooperation Agency (CIDCA) and a host of Chinese companies offering loan financing to African governments for goods and services. Figure 4 provides a depiction of Chinese financiers to Africa from 2000-2020.
Figure 4: Chinese Loans to Africa by Financiers, 2000-2020

As seen in Figure 5, loans to the transportation sector constitute 29 percent of all commitments and loans to the power sector make up 25 percent. These sectors include railways, roads, ports, airports, power plants and transmission lines. The mining sector receives the third largest aggregate amount of loans, representing 11 percent of total loan commitments to projects including cash flow and mining development for national oil companies. Loans to the ICT sector account for 8 percent of total loan commitments. Loans funneled into these four sectors represent a breadth of support for infrastructure development throughout the region.
Figure 5: Chinese Loans to Africa by Sectors, 2000-2020
Given the prominent role Chinese loans have played in infrastructure development throughout Africa, the observed downward trend since peaking in the mid-2010s begs the question of whether Chinese loans to Africa are drying up. Due to the business-oriented and strategic nature of Chinese lending, loans to Africa tend to decrease during times of crisis. The pullback in Africa also matches declining trends in Latin America and the Caribbean, although the regions are politically and economically distinct. Based on these factors, the decline in loans to the region may be the result of long-term factors such as a policy shift, rather than the result of short-term volatility and shock.
In the future, other sources of financing including foreign direct investment (FDI), Chinese loans directed to African regional banks for on-lending and loans from Chinese-led multilateral development banks, could play a larger role. As the pandemic continues to wreak havoc on livelihoods within China and the debt position of some African countries, shifts in financing types and sources are expected for future Chinese financing to Africa.
Read the Policy Brief*
Never miss an update: Subscribe to updates from the Global China Initiative.