Tips & Tricks
Most, but not all, of the following tips were originally published in the Business Warehouse Newsletter. This is a list of items that seek to answer a spectrum of "how do I...." questions raised by report users.
Running a Report: Tips for Using the Variable Entry Screen
Entering Dates
Here is something that you may not know about: instead of entering date information in the long format that SAP uses, you can enter dates using simpler notation. Complete information is available in the Help document BW How to - Specify Report Dates, but here are a few examples:
| Instead of... | You can enter this... | Note |
| 01/01/2015 | 1/1/15 | Calendar Year notation |
| 03/28/2014 - 06/14/2014 | 3/28/14 - 6/14/14 | Don't forget to use the delimiter space + dash + space |
| 04/2015 | 4/15 | Fiscal Year notation |
| 01/2015; 02/2015; 03;2015 | 1/15 - 3/15 | Remember the delimiter! |
| To specify all periods in FY 2015 through the current period | >=1/15 | Selects periods 1 through the current period (doesn't work in all reports) |
Using Patterns in the Variable Entry Screen
This tip is somewhat esoteric, and it is not guaranteed to work for all BW reports, but there are times when it comes in handy. Suppose you want to view all Internal Service Request (ISR) or Facilities Service Request (FSR) activity for a Funds Center during a specified period. You know, I hope, that nearly all of the GL accounts associated with ISRs and FSRs begin with 89. Using this fact, you can run a report and specify GL / Commitment Item on the Variable Entry screen like this:
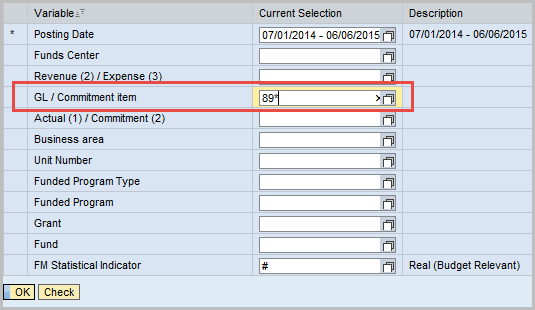
All you need to do is enter 89, the first two digits of the GLs you seek, followed by a wild-card character ("*"). This specification limits report data to only GL account numbers that begin with 89, regardless of what characters follow these key digits. By the way, you can use this tip (or is it a trick?) when finding open commitments, as described in the previous tip.
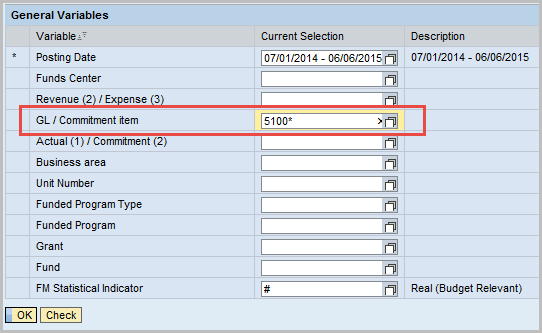
Another example is this: suppose you want to see all supplies expenses. Examining the current list of GL account numbers posted on the Comptroller's Resources page (http://www.bu.edu/cfo/comptroller/resources/), notice that all numbers associated with supplies begin with 5100. Given that pattern, you could specify this string in the GL / Commitment Item field on the Variable Entry Screen:
Create and use a Report Variant
Do you find that you frequently specify the same variable values when executing a BW report? By using a Variant, it is possible to save those variable values so they can be recalled, thereby avoiding the need to specify them again. Unlike a saved View (aka favorite), a Variant is available only to you and only to the report for which the Variant is created. You can create as many Variants as you need for any BW report and it's easy to delete Variants when you no longer need them.
This video demonstrates the simple steps to create and/or to use a Variant: watch the video
Would you prefer to read a document? This Help guide describes what you need to know: BW How to - Save and Use a Variant.
Tips for Filtering Report Data
Two resources exist to describe in detail how to filter report data:Overview of Filtering
This brief video demonstrates the shortcut methods to filter by inclusion (show everything that matches specified criteria) and exclusion (show everything except those items that match specified criteria). View the video.Shortcut Methods to Filter a Characteristic
Tips Involving Key Figures (report metrics)
Filter Key Figures Based on Threshold Values
Have you ever wanted to remove all of the $0 commitment amounts in your list of open commitments? Or have you needed to find all purchases that fall within a particular range of dollar amounts? If so, this document describes how to do exactly that: BW How to - Filter Key Figures using the Condition Function (PDF). Or, if you prefer, this Over the Shoulder video demonstrates the process. The video includes a brief tutorial on finding open commitments, too.
Adding a Calculation Based on Report Key Figures
Did you know you can perform a calculation on the fly based on Key Figure data? Here is a video that provides two examples of adding calculations to a report: BW How to - Create a Calculated Key Figure
Adding a Percentage Calculation to a Report
Did you know there is a BW built-in function that allows you to calculate the percentage one Key Figure represents relative to another Key Figure? To learn how, consider the example below (if you prefer watching a video, you can see this same example demonstrated in this video).
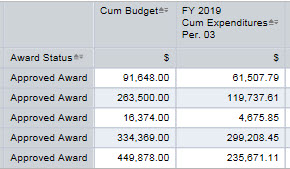
Suppose you have run a report to view budgets and cumulative expenses (the screenshots in this example are based on the GM Budget versus Actual report, but the following steps can be applied in any situation in which you want to determine percentages). As you can see, the data in the report has been pared to the point where we see only budget amounts and corresponding expenditures. Imagine that we want to determine what percentage of each line item budget amount has been spent thus far this year.
Here are the steps to generate a new column (i.e., a Calculated Key Figure) showing the expenditures as a percentage of the budget:

- I want to place the new percentage Key Figure to the right of the Expenditures column, so I right-click on the Cumulative Expenditures Key Figure to display the context menu (the new column will placed to the right of the Key Figure I clicked on).
- Slide the cursor down to Calculations and Transformations and move right across Formulas to click on New Formula to display the Formula Editor window.
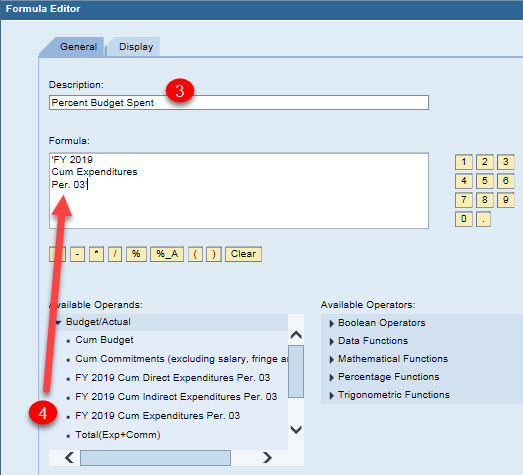
- Enter a Description. This will be the name of the new Key Figure
- In the Available Operands column, click on the expenditures Key Figure, FY 2019 Cum Expenditures Per 03, to insert this data field into the Formula window

- Click the yellow % _A button to insert the percentage operator into the Formula window
- Click on the Cum Budget operand. This adds the budget Key Figure to the formula.
- Click on the OK button to perform the calculation and insert the new Key Figure in the report
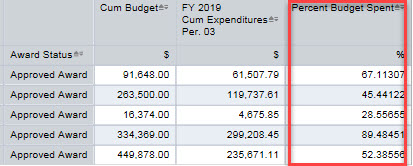
Here is the result with the new Key Figure added:
More detail about this percentage function, and one related function, is available on this SAP Help page.
Filtering Report Key Figures (aka Show or Hide a Key Figure)
Did you know that some reports contain more Key Figures than are initially displayed when the report is run? In those cases, you may want to show one or more of those "hidden" metrics.
Why might you want to hide a Key Figure? For the same reason that you might remove multiple Characteristics from a report - to streamline output by displaying only data that is essential to answering a particular question.
Showing or hiding a Key Figure relies on the Filter command, and this Help guide describes both operations: BW How to - Hide or Show a Key Figure.
Tips Involving Characteristics
Filtering Report Characteristics
Filtering Report Data via Shortcut Methods
Watch this Video Tip to learn how to quickly filter data
Overview of Filtering
The process of filtering data - restricting displayed data based on parameters you specify - is the number one mechanism used to answer questions related to data in users' BW reports. For that reason, it is worth taking a few minutes to examine this command more closely.
Virtually any report Characteristic can be filtered. For example, you can filter by:
Account numbers or text associated with Funds Centers, Internal Orders, or G/L's,...

... detailed descriptions,...


Once you have identified the Characteristic(s) to be filtered, either of two types of filter can be applied:
| Filter Type | Description |
| Inclusive | Only those records that match the (one or more) parameters specified by the user are displayed. Filtering by inclusion is the default mode when applying a filter |
| Exclusive | Filter by exclusion: any record that matches the parameters specified is excluded from the display, i.e., all records except those records that match are shown |
Furthermore, there are different ways to implement a filter. A common process involves right-clicking on a column heading (i.e., on the name of a Characteristic) and setting up the filter, like this:
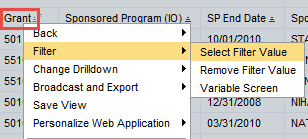
In this case, you are essentially saying "show me a list of all the values for Grant in my report. I will look through this list and select the value (or values) on which I want to restrict my view." This is the long form of establishing a filter. The shortcut forms of filtering either by inclusion or exclusion are described in this video.
For an overview of filtering using any of these methods, refer to this Help guide: BW How to - Filter Report Data.
The ability to organize data according to your needs is a powerful feature that every report user should be familiar with. This video describes how to use column positions when organizing/sorting data within a report. Organizing Report Data on the Basis of Column Position
As an experienced user, you are probably familiar with adding and removing Characteristics and Key Figures in a report. You may also know that multiple Key Figures can be added or removed in a single step, while the same operations involving Characteristics require one step per action (if you're not familiar with either of these fun facts, take a few minutes to read these Help Guides: How to - Add, Remove, or Move a Column in a Report and BW-How-to-Hide-or-Show-a-Key-Figure). Actually, it is possible to combine two steps into one when working with Characteristics. Here's how: Using Swap to Operate on Two Characteristics Simultaneously
 In this example, we want to (1) remove the Characteristic Emp Change From Date and (2) add the Free Characteristic Action Start Date
 To combine these two steps into a single action, click on Action Start Date and drag it into the Rows area until your cursor is positioned directly on top of the Characteristic to be removed. The light blue highlighting indicates that a swap will occur
 When the action has completed, Action Start Date is displayed in the report and Emp Change from Date has been moved to the Free Characteristics area.
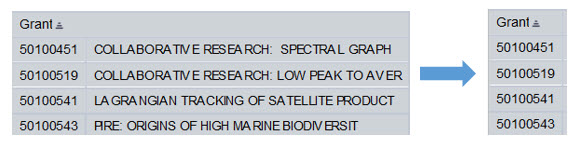
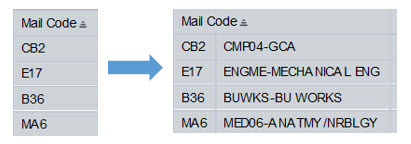
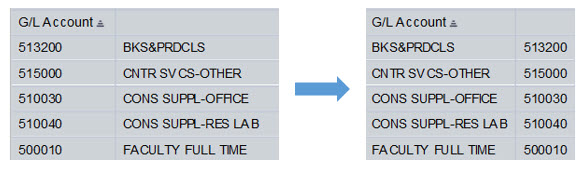
Did you know you can change the way Characteristics are displayed? Here are some examples of ways in which you might want to change the appearance of a Characteristic: Remove the text description for grants in your report: Add text to see the location corresponding to a mail code: Swap the order in which the Key and Text of a GL Account Number are shown: This video tip describes how to make modifications like these, and more.Changing the Data Displayed by a Characteristic
Typically, adding a Characteristic to a report from the Free Characteristics list is easy to accomplish by clicking and dragging that data element. There are times, though, when the Free Characteristics list is long and the item you want to add is well down in the list. The drag-and-drop method will still work, but the process can sometimes prove cumbersome. It turns out there is an alternative method you can use. This Help Guide describes this shortcut method: How to - Add a Free Characteristic via the Right-click Method For a detailed description of adding, moving and removing Characteristics within a report, refer to this video.Right-click Method of Adding a Free Characteristic to a Report
Working with Saved Views
This video describes how to save and use a View (a custom layout of a BW report) and includes how to replace/overwrite an existing View, how to examine the display properties of a View, or how to delete a View you no longer need (this overview is presented in video format)How to Create and Use a Saved View
Saving a View (the layout of a report you have customized) is a real time saver and is unquestionably one of the most powerful and heavily-used features of the BW reporting toolset. The process of creating and using a View is described in this Video and this Help Guide. When it comes to running one of your saved Views - if it contains a filter - it's important to exercise care. Depending upon how the filter was applied, it's possible your View may not display data added to the warehouse after you saved it. Consider these use-cases: 1. Using the GM Budget vs. Actuals report, you create a View to display all of the active grants that you are responsible for. You can achieve this by setting a filter that excludes any grant with a closed status. In this case, your View will always show only your active awards; even if a grant is closed after the date on which you saved the View, the filter to exclude closed grants will correctly apply. That is, the filter you applied is dynamic. 2. The technique outlined for identifying Concur data in a BW report includes a step in which all active Concur expense items are selected using a filter. If you save your customized report as a View, it will be based on a static list of account numbers. The next time you run your View, you must be careful to update the filter with Concur account numbers that are in effect at that time. The moral of the story? If your View contains one or more filters, you must be aware of whether those filters are static or dynamic. If they are static, you will have to reapply them in order to see all of your data whenever you again run the View.Beware Static Data!
Want to do a little housecleaning with your saved Views? Report users can't directly delete Views that are no longer needed, but the BW team can help with that. Use this form to enter up to 10 View names and a member of the BW Development team will delete the View(s) for you.Deleting Old Views
Searching for Information
A diverse array of materials has been developed to provide answers to all sorts of reporting questions. This overview video provides a high-level look at those materials and describes how to access them. I encourage you to spend just six minutes to familiarize yourself with these materials. The time you spend watching the video now will be returned many times over in the future by showing you how to answer your questions - whether those questions are about reports, the data they contain, or the various ways in which you can control how report data is displayed.Overview of BW Help Resources
Here’s a dark thought for you: suppose a BW Newsletter containing a Tips & Tricks section isn’t available to you. How would you learn good stuff like how to create your own grant report or what shortcuts are available to you for specifying dates? Take 2 minutes to view this video and learn how to find the help file you are looking for within the BUworks online Help resources.Finding the Help You Need - using the Search Box
This Over the Shoulder video describes how to view open commitments and how to filter Key Figures (metrics) based on a specified threshold value. The Funds Management Transaction Detail report makes it remarkably easy to view open commitments. This Help guide describes the process recommended to identify all open commitments for a Funds Center, grant or internal order as of a specified date: BW How to - View Open Commitments (PDF).Finding Open Commitments
Goods or services provided by vendors internal to Boston University are procured via Internal Service Requests (ISRs) or Facilities Service Requests (FSRs). This Help Guide provides a step-by-step look at how to filter data in the Funds Management Transaction Detail to allow you to focus solely on ISR/FSR activity. Finding ISR and FSR Activity in a Funds Management Report
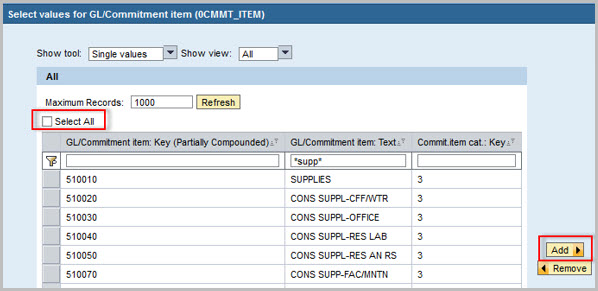
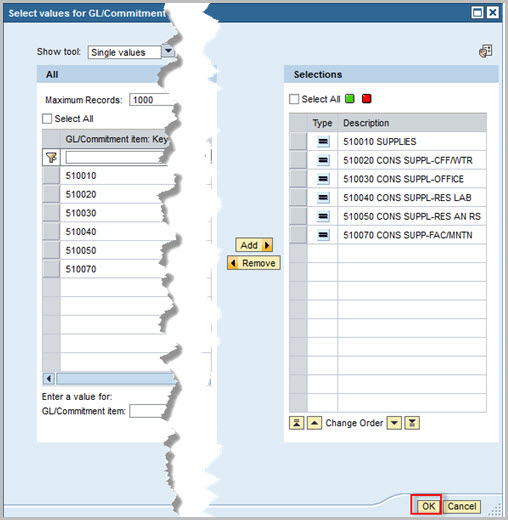
When using Business Warehouse (BW) reports, situations will arise in which you must enter a value to run a report or to filter data. If you don’t have the required information readily available, you can use one of the techniques described in the document BW How to - Perform an information lookup to look up that information. Here’s one example pulled from the document: searching the Commitment Item text description to find specific items: Business need: we want to modify a report to limit the data displayed to show only expenses related to the purchase of supplies. Solution: filter the Commitment Item Characteristic to see all that make a reference to “supplies” (or some variant of that term) in the description. This example assumes you have already run a BW report and are now in the process of filtering on Commitment Item. Click in the Text column of the highlighted filter row. Enter *SUPP* to search for any Commitment Item containing the letters “SUPP.” The wild card characters (*) indicate any combination of characters may precede or follow the string we are searching for. Hit the Return/Enter key or press the Refresh button to begin the search. Note the various forms of “supply” the search string matched: “supplies”, “cons suppl”, and “cons supp”. This points out the importance of specifying a string that is long enough to avoid any superfluous matches, but not so long that the data you are looking for is missed (e.g., entering "suppl" would have missed the Consumable Supplies GL). Click the Select All checkbox to select all of the items in the list. If you don’t want to filter on the entire list, click specific items to include them in the filter. Click the Add button to move the selected items to the Selections column. Once the selected items have been added to the Selections column, click the OK button to activate the filter.Searching for a value when running a report or filtering report data

If you need help with filtering, refer to the document BW How to - Filter Report Data, available in the BW Document Library.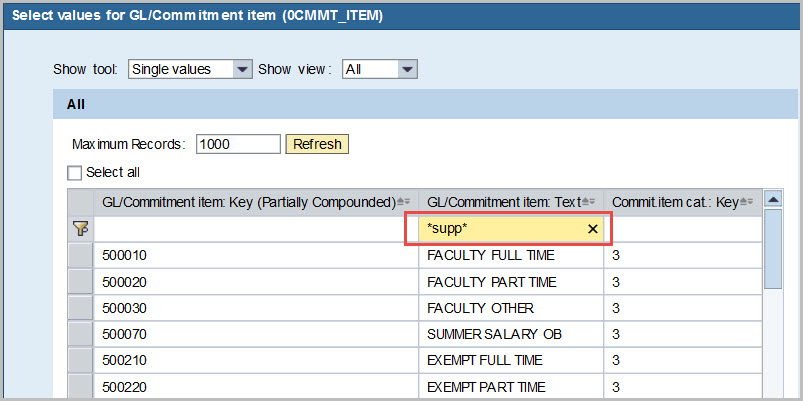
Using search strings and wild card characters in a search
Do you understand how to use search strings with wild card characters when specifying variable values (before you run a report) or when filtering data (after you run the report)? A recently posted Help Guide describes how to understand when to use search strings like the following:
buw* or *buw or *buw*
It's a quick read and the pay-back on understanding how to use wild cards is worth it! Take a few minutes and read the document How to Use Wild Card Characters in Searches.
Employee Information
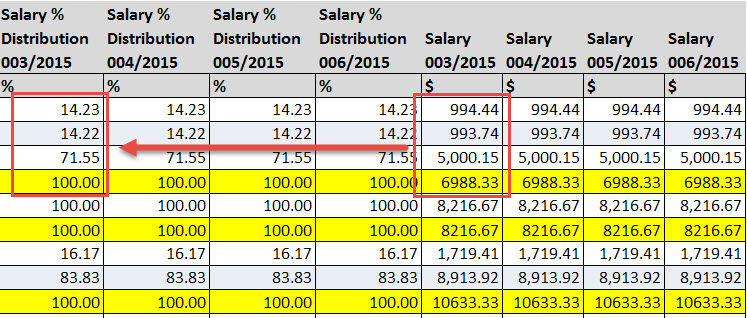
Each of the Labor Distribution reports (PA12, PA15 and Labor Distribution Funds Center) contains Key Figures to display percentages corresponding to the payment amounts displayed in the Salary, Salary Accrual, and Total Gross Key Figures. These percentages are hidden initially but, when they are made visible, report output looks like this: In this example, Salary % Distribution percentage shows the percentage represented by each payment amount, by funding source, tied to employee payments. Percentages are available for the Salary Accrual and Total Gross Key Figures, too. Related resources:Creating a Split Cost Distribution Report
Create an Employee Directory for Your School/College/Department
How might you create a roster of employees in your organizational unit? The Faculty and Staff Directory report, available to managers and payroll coordinators, allows you to do just that. The report is chock full of useful data, including employee name, office address and phone number, as well as manager name and email address. Furthermore, two Organization Unit levels are available, so you can build an organizational view of your department or school/college in roster format.
An important feature of the report is that it is not limited by the permissions of the person running the report. Thus, if you can run the report, you can view the organizational assignment of any member of the faculty or staff across the University. As a result, using the report is a great way to look someone up in another department.
By the way, this is just one of several useful reports in the Employee Data (Distributed) folder. To learn more about the employee master data and associated reports, visit the Employee Model project web page, which includes an HCM Employee Model Users Guide.
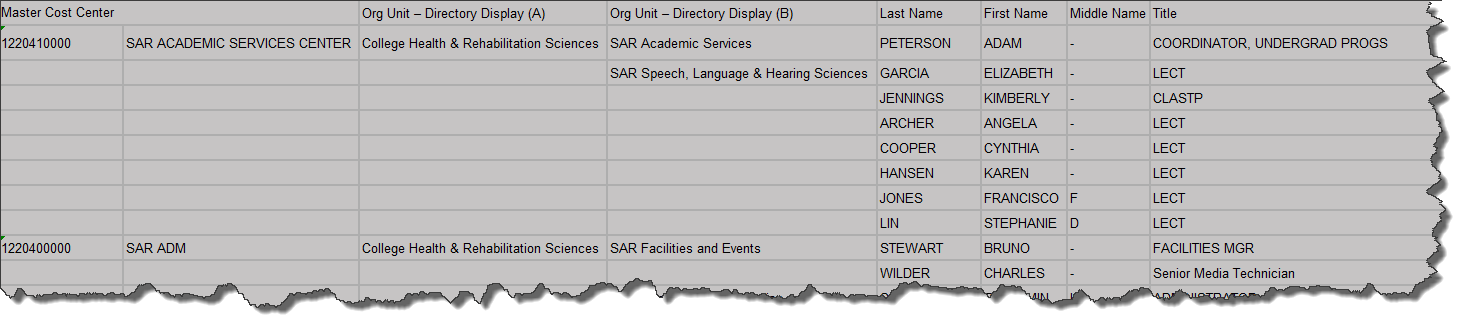
Returning to the Faculty and Staff Directory report, here is an example of a roster-based org chart you might build for your organization:
Click to enlarge image
To see the steps involved in building a roster like this, review this Help guide: BW How to - Build an Org Unit-based Departmental Directory.
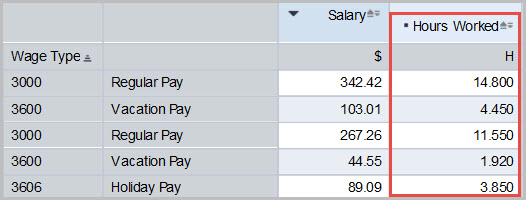
If you're a payroll coordinator or a manager, this is an easy question to answer. Each of the three primary Labor Distribution reports - Payroll Inquiry by Distribution (PA12), Payroll Inquiry by Employee (PA15), and Funds Center Report - display the hours worked that correspond to pay for a given period. When one of these reports is run, the initial display includes the Salary Key Figure. Note the black triangle, which indicates this is a hierarchical field (one that contains additional data). Clicking on the triangle reveals the additional data - in this case, the hours attributed to various Wage Types for two employees. That's all there is to it! Note that you can hide the Hours Worked column by clicking again on the black triangle.How Many Hours Did a Weekly-paid Employee Work?

Developing a Record of Employee Leaves of Absence
Payroll Coordinators and anyone with an MSS Manager role have access to the report Employee Absence Tracking – Historical View. The report shows quotas earned and used for sick, vacation, personal and compensation time types. You can view a daily or monthly breakdown of time accrued or used, as well as the remaining balance. With a minimum of work, you can develop a report that displays time amounts by month:
![]()
Or you can view that same data broken out by day:
![]()
Notice that times are displayed as hours. It is also possible to display hours as days. That conversion tip, and more detail regarding the report, is available in this Help Guide: BW-How-to-Run-HCM-Employee-Absence-Tracking-report-Historical-View.pdf
Searching for information about an employee who is a manager in another department? A Business Warehouse report exists that provides information, including name, phone number, and email address, for all managers in any department at the University. The Faculty and Staff Directory report, available to Payroll Coordinators and MSS Managers, is searchable by Master Cost Center or Org Unit and is described in the HCM Employee Model Reporting User's Guide. Training is available for this and for all reports based on the HCM Employee Model.Manager Information
Miscellaneous
Suppose you attempt to add or remove data or apply a filter, for example, and the result is not what you were expecting. Or imagine that while working in a report your hand slipped or your finger twitched and you somehow changed the report. How can you undo the last action you took, regardless of what that action was? This Help Guide answers that question. How to Undo a Previous Action
“Drilling” is the process of navigating from one BW report to another report in order to view data details that underlie a summary cell or cells in the report being drilled from. The report drilled to might be another BW report or a transaction in the Finance system. View the video.Drilling to View Additional Data Detail
Did you know that when watching any of the longer BW instructional videos you can jump directly to content you're interested in, rewind or fast-forward the video, or control playback speed? This one minute video describes how to do exactly that. Review of Controls Available in BW Instructional Videos
The BW Document Library contains a Job Aids section. As the name suggests, Job Aids are intended to help you do your job. They are Guides that target specific business questions commonly asked by report users in various functional areas. Topics addressed include finding open commitments, P-card information, etc. A list of Job Aids is available on this Web page. Aids are currently available for topics related to jobs performed by grant administrators, payroll coordinators, shoppers/approvers, and financial administrators. As to the “why should you care?” question, the answer is this: Job Aids have provided the basis for many of the items appearing in this Tips & Tricks section of the Newsletter. If you’re looking for help you can use when performing your job, investigating existing Job Aids is a great place to start. Do you have an idea for an additional Aid? Drop me a note via email or chat with me on Teams and let’s discuss your idea.Job Aids: What are They and Why Should I Care?
The BW Document Library contains a Web page that lists a minimal set of functions that every Business Warehouse report user should be familiar with and learn to use. These functions will save you time and allow you to more easily address the questions you seek to answer when running reports. The list of documents describe tips and tricks that include ways to filter data, save or use views, or efficiently search for specific names or account numbers. Once you are comfortable with reporting tool basics, move on to this list of more advanced functionality. You may find that you don't use these capabilities as frequently as you do the basic tools, but you will discover that they are enormously helpful when you are trying to perform specific tasks. Take a look and decide for yourself whether you can use any of these tools.What are the Basic BW Tools I Should be Familiar with to do My Job?
Browsers are not "one size fits all." Choosing which browser you use should be based on your platform (Windows PC or Mac) and your needs/preferences. Use the chart below to help you select a browser that is appropriate to your needs. Note: most browsers are set up by default to suppress pop-up windows. When using any of the browsers above for the first time, you may need to configure your Pop-up Blocker Settings to allow BW reports to display (the reports require pop-ups). This TechWeb page contains configuration details.What Browsers Can/Should I use with BUworks (BW Reporting and WebGUI Transactions?
Works with
Browser
Windows PC
Mac
Note
Firefox
Yes
Yes
Supports use of copy/paste from a BW report to another destination, e.g., another report or a spreadsheet (MacOS only).
Chrome
Yes
Yes
A common complaint I hear is that, once BW report users have followed the instructions in the Help Guide How to View Concur Expense Activity in a BW Report, they still don't see enough detail to help them determine what event some transactions are tied to. Here's an important tip that should help with this problem: the Report Name field in a Concur report is used to populate the Text field in the BW Transaction Detail report (this is the report used in the how-to guide mentioned previously). The Report Name field, then, is where you should add any descriptive text you will need to understand the purpose of an expense item when later reviewing data in your BW report. Refer to the Help Guide for full details on how to view Concur activity using a BW report.Concur Expense Reports: Adding Useful Descriptive Text
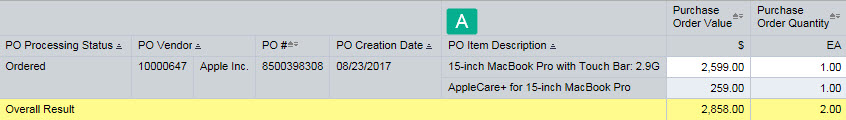
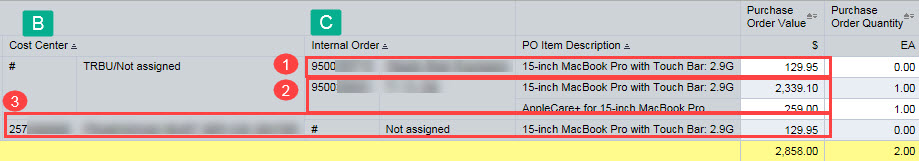
Multiple items can be ordered via a single Purchase Requisition (PR). Furthermore, costs for those items may be spread across more than one cost object. For example, unrestricted departmental funds may be used to pay for some of the items and one or more grants may be used to pay for other items. For situations like this, how can a BW report be used to view the cost objects involved? One way to do this is to use the Purchasing Document Lifecycle (PDL) report located in the Procurement/Guided BUying folder. In the screen shot below, the PDL report was run for a specific Purchase Order and the Free Characteristic PO Item Description (A) was added to show the individual items in the PO. In this case the purchase involves a laptop computer and a maintenance contract for the computer. In the following screen shot, the cost objects Cost Center (B) and Internal Order (C) were added. With these two Characteristics visible, it is now possible to see how the charges for these two items were split across three cost objects: a cost center (3) and two grants (1, 2). Furthermore, notice that the Macbook Pro expense was distributed across all three objects, while the AppleCare maintenance agreement was charged to a single grant (2).View Purchase Order Costs Distributed Over Multiple Cost Objects
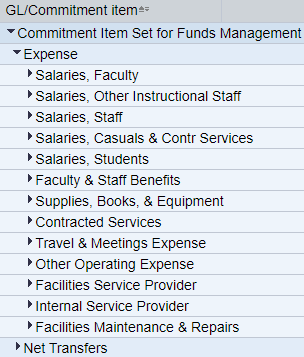
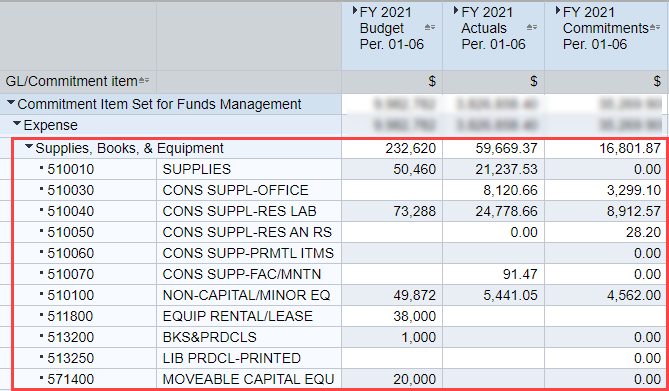
In a recent FM intermediate training session (What? You use FM reports and you haven't attended an intermediate-level session yet? What are you waiting for?), a question arose about whether it is possible to arrange Commitment Item revenue and expense data in such a way that logically related items were grouped together. The answer is yes! The process involves displaying something named Commitment Item Sets. Here is an example of the Commitment Item sets for one Funds Center: And this is what the content of one of those sets, the Supplies, Books & Equipment set, might look like: Want to know more? The step-by-step process for displaying these sets is described in this Help Guide: How to - View Funds Management Hierarchy in a BW Report.View Aggregated Funds Management Commitment Item Data