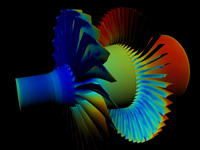
Scientific visualization is the practice of producing graphics representations of scientific phenomena. This may be part of the research process, when the graphics are used for understanding, interpretation, exploration, and may guide the direction of the research itself, from tweaking parameters to asking new questions. It may similarly be used in production environments, such as medical procedures, as one part of a larger mission. It may be used for educational or persuasive purposes, in the classroom, grant applications, site reviews, etc.
In this tutorial, we will give an introduction to the field of scientific visualization. Scientific visualization is a field in and of itself, so we will cover only the topics which are most likely to be of use to users in our community who are new to the field. We will provide information on some of the available tools, in particular the ones available at Boston University under the auspices of SCV. We will give some tips for choosing the tools which will best serve your needs, provide references, and also offer our services to members of the BU community. You will find here:
- Techniques for presenting numerical data visually.
- How to prepare you data for use with scientific visualization software tools.
- Packages provided by the Scientific Computing and Visualization group.
- Helpful references.

