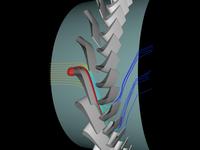
Scientific data comes in all shapes and sizes. The field of visualization has primarily focused on spatial phenomena, i.e. functions whose domain is 3-dimensional. Representation of 2-d data is generally categorized as plotting. For help with plotting, please see: SCV Introduction to Plotting Packages Tutorial. We present here techniques for looking at data whose domain is in 3-dimensional space, and whose attributes are either scalars or vectors.
- Scalar data

