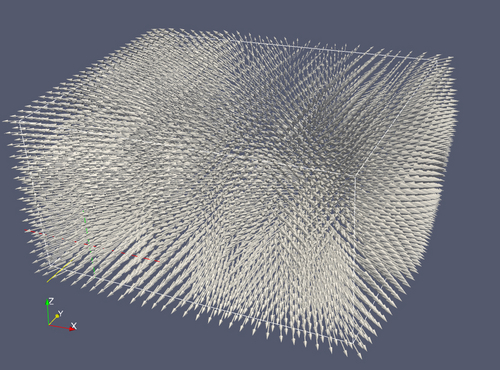
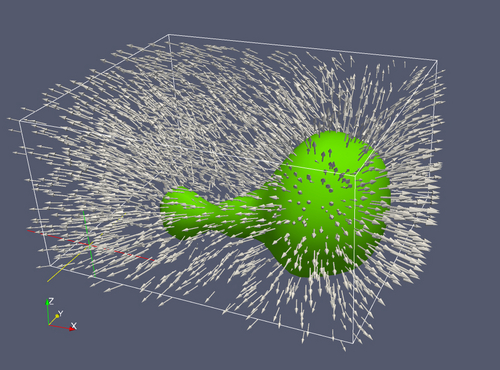
When the data attributes are vectors, we have a very different visual problem to solve. Perhaps the most natural thing to do, since we often think of vectors as arrows, is to show a vector field as a set of arrows, one for each grid point.
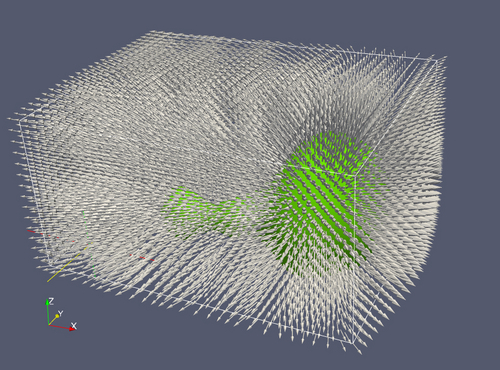
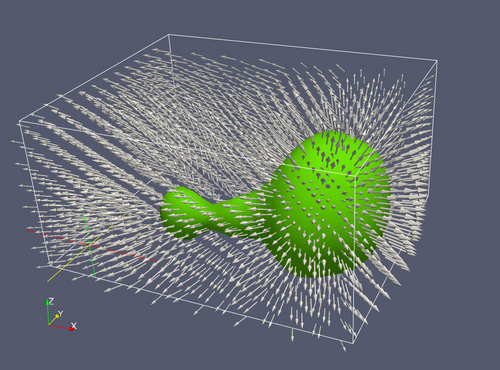
We can include other visualization techniques, such as a colored isosurface.
Drawing vectors at every point is visually dense, and yields Moire-like effects. An alternative is to show fewer vectors; here we have still used a regular pattern.
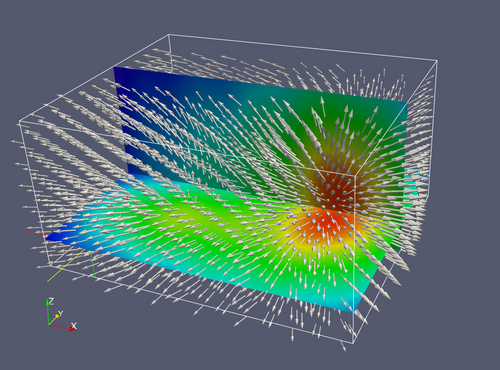
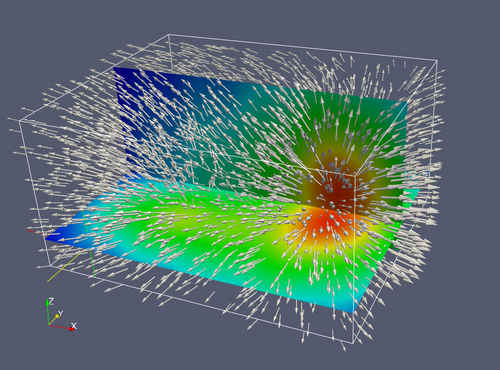
The same vector display, shown with two slice planes.
Here we draw fewer vectors, but with the locations chosen randomly rather than from a regular pattern. By taking away the pattern element, our visual system may be able to better see the “flow” of the vectors.
The same random vector display, shown with two slice planes.
Sometimes we wish to try to show more complex representations with a set of vector representations, and by their visual prominence arrows may be too “busy”. We can represent the vectors simply as line segments, and while we lose the directional information about them, we may still see the “flow” of the field. He we show line segments with multiple colored, translucent isosurfaces.
![]()