We are considering here functions whose domain is 3-dimensional, and whose range is scalar.
A visual technique which we will use throughout the tutorial is that of applying a color map (also known as pseudo-coloring). This involves assigning a different color to each value in the function’s range, so that color visually conveys numeric information. For points in the domain other than the input grid points, the function can be interpolated, and the resulting scalar can be used with the color map.
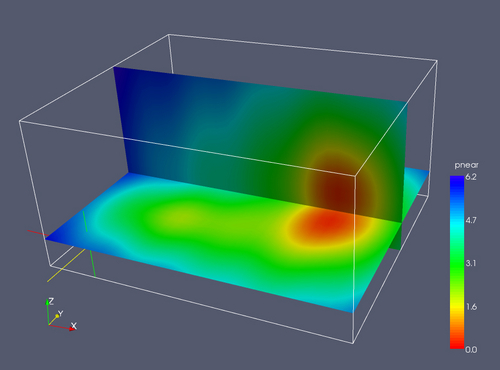
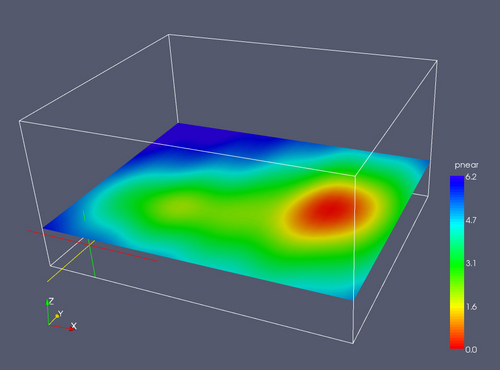
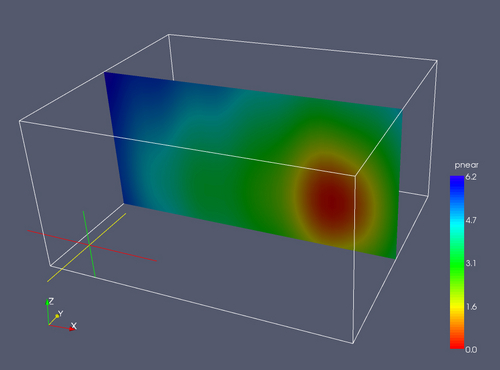
A plane can be specified cutting through the domain; packages often support doing this interactively. Slicing the 3-d volume with a plane reduces the dimensionality to 2. Applying a colormap to this planes allows the viewer to see a colored contour map of the function on that slice. Note the color legend, which allows the viewer to look for values of interest by color. Conversely, if one is interested in finding the value at a particular location, one can do so by looking up the color in the color legend.
Any orientation is possible, though using a plane perpendicular to a coordinate axis is most common. Here we show a vertical slice.
Using multiple cut planes may convey more information.