Rather than try to show the vector fields using separate glyphs, such as arrows, we can try to visualize the curved shape of the vector field by drawing linear elements which follow field lines. Intuitively you can think of this as dropping a particle into a flow, and tracing out its path (but since the vector fields we are considering here are not time-varying, what we are really doing is defining curves by requiring that they always be tangent to the gradient).
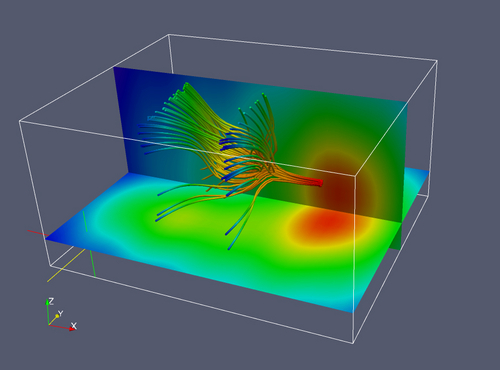
Streaklines eminating from a “source”, shown with two slice planes.

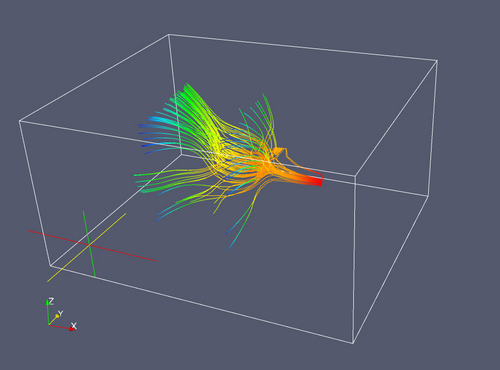
Streaklines eminating from a “source”, colored by the scalar data.
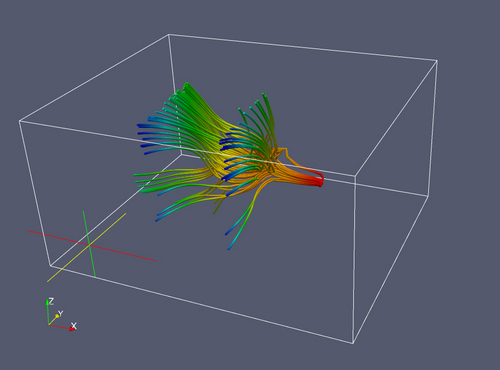
Rendering the streaklines as tubes allows rendering with surface shading – which helps our eyes see thire orientations more accurately.
Streaktubes, with slice planes.
Streaktubes, with multiple colored, translucent isosurfaces.
![]()
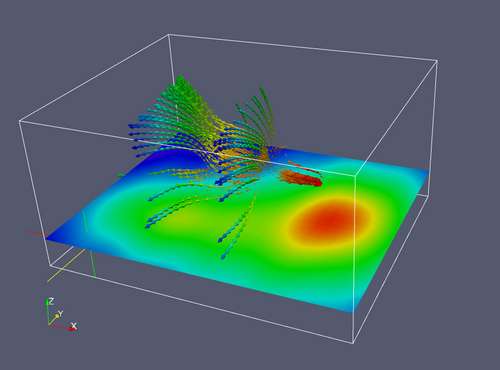
Yet another way to represent the field lines is to draw glyphs (here arrows) along the paths.
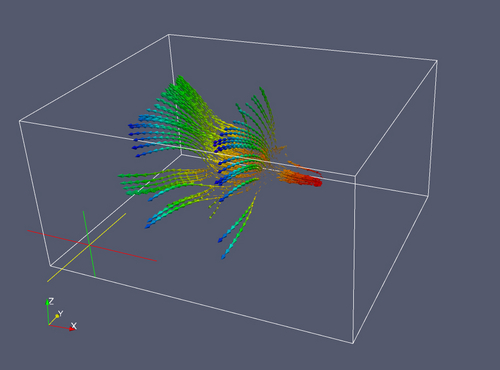
The same rendering, shown with a horizontal slice plane.