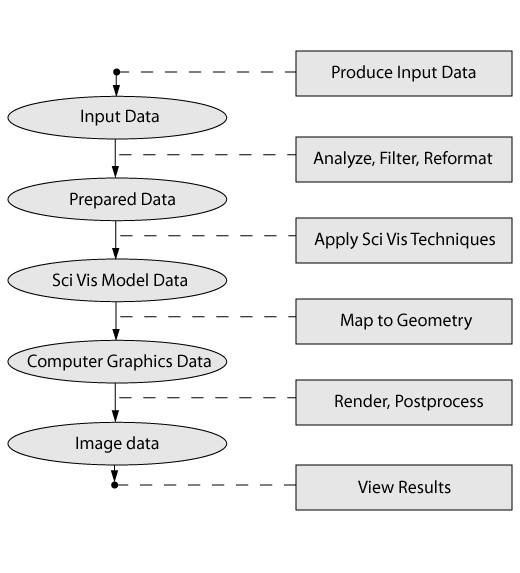
There are a number of steps between raw data and a finished visualization. In some cases you may be able to use one tool for the full data-to-pictures process – many people do all of their work, including graphical display, using a single package such as Matlab. In other cases, you may use multiple tools – for instance, you might use different software for each of these tasks: data collection, data analysis, conversion into a form for visualization, applying visualization techniques, and producing beautifully rendered output. Whether within one package, or distributed across many, the steps represented in the figure below occur in any visualization.
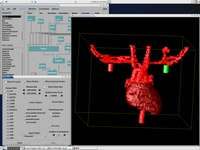
Let’s look at one example, a steady-state simulation of fluid flow through some sort of cavity.
- Use a simulation program to produce pressures at a set of points. (Produce input data.)
- Compute the gradient of pressure to produce vectors at each of the set of input data points. (Analyze, filter, reformat.)
- Drop virtual particles into this vector field, and compute the path they would follow in the field. (Apply scientific visualization techniques.)
- Produce a set of polygons representing a tube bent to match the path. (Map to geometry.)
- Create a digital image from a virtual camera of the polygonal model. (Render, postprocess.)
- Use a web browser to view the resulting image. (View results.)
From the point of our discussion of scientific visualization, the focus of this process is the application of scientific visualization techniques to create a renderable geometric model. In the middle stages of this flow of data through the pipeline lies a conversion from specific models in the science domain to those of the graphics domain. The representations which lie between the science-specific model and the graphics data structure which are common to many domains – this collection of techniques/representations/models comprises the heart of scientific visualization. Most sci-vis packages actually include the full pipeline, with varying degrees of depth on the ends.
As another example, the Vortex Shedding Simulation web page gives a workflow diagram showing the packages used for production of a computational fluid dynamics animation.