Nucleation of the Modulated Phase in CuAu: Lamelle or Labyrinth
Nicholas Angelo Gross (Boston University)
Ken Elder (Oakland University)
Bulbul Chakraborty (Brandeis University)

The Equations
The vast majority of synthetic and naturally occurring materials
contain long-lived non-equilibrium morphologies which often determine the material properties. The binary alloy CuAu is an excellent example of such a material because it exhibits a modulated phases along with the standard ordered and disordered phases. A continuum free energy for CuAu was derived from an atomistic Hamiltonian {B. Chakraborty and
Z. Xi, Phys. Rev. Lett 68, 2039 (1992)} and from this an equation of motion can be derived. The free energy and equation of motion are given below.


The Order Parameter
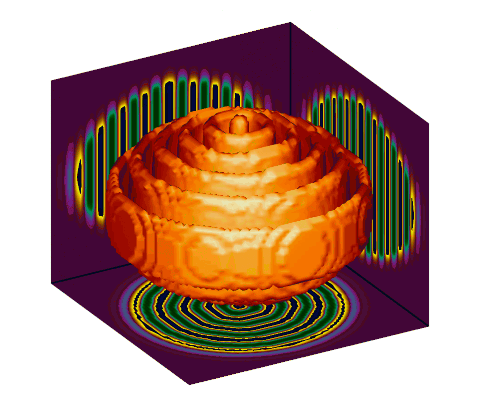
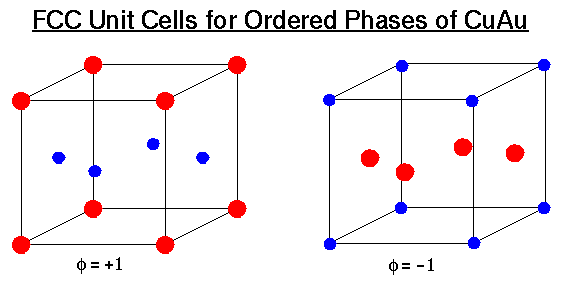
The units cells for the two ordered phases of CuAu are shown. The order parameter, h, represents the concentration difference between copper and gold. For the cell on the left h is set to +1, which would correspond to the red areas in the figures at the bottom, while for the cell on the right h is set to -1, which corresponds to the blue in the figures. If these two cells were placed side by side the area between them would correspond to a phase boundary. The isosurface shown above is a 3D representation is just such a boundary.

The Phase Diagram
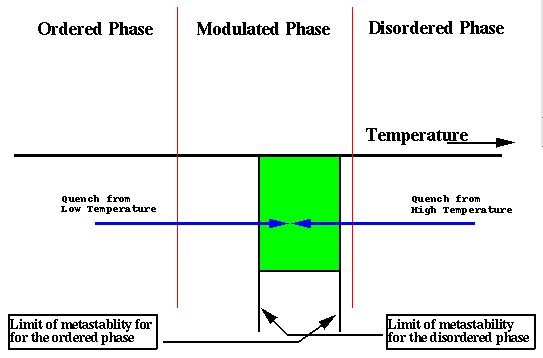
The phase diagram for this model is shown on the right. The free continuum free energy predicts two first order phase transitions; one from a high temperature disordered superlattice to a modulated superlattice and the other from the modulated phase to a low temperature ordered superlattice. This is depicted in the phase diagram on the right. The modulated phase arises in the model due to competition between the gradient squared and Laplacian squared term which operate in the X-Y plane. This competition between the derivatives models the competition between the ordering of the atoms shown above and the incommensurate sizes of the Cu and Au sheets. The modulated phase is a region where these two forces are roughly equivalent and so a compromise is struck. There is no such competition perpendicular to the X-Y plane and so the structure is uniform in that direction as is shown in the figure at the top.
The system can be prepared either in the low temperature ordered phase or the high temperature disordered phase and then quenched into the modulated phase. There is a region, shown here in green, where both the ordered and disordered phases are metastable to the modulated phase and so both must nucleate the metastable phase. The dynamics for each quench however will be very different.

The Simulations
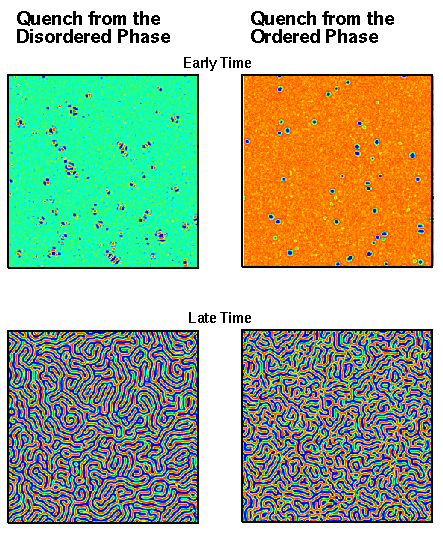
The figures shown on the left are snapshots of a 512×512 simulations. The simulation were done on an 8 nodes of an SGI Power Challenge Array. The figures are group in pairs, top and bottom. The two figures on the left are snapshots at different times for a simulation whose initial conditions were random while the figures on the right are from a simulations whose initial conditions were completely ordered; thus the figures on the left show a system prepared at high temperature, while the one on the right show a system prepared at low temperature. Both systems are quenched to the same temperature in the green region shown in the phase diagram, but their evolution is very different. We can see at early times that the system on the left forms droplets which already have the modulation built into them while the system on the right forms compact droplets which will have to branch and interact to form a modulated phase. We see at late times that the figure on the left is interconnected while the figure on the right is made up of disconnected structures. This is true even though the overall order parameter is roughly equal in both images; that is to say the ratio of blue regions to to red is roughly the same. It should also be noted that the figure on the right was take at a later time the the one on the left; so the quench from the ordered phase evolves more slowly then that from the disordered phase.
