Douglas L. Sondak and Erik Brisson – Boston University
A simulation of vortex shedding over a right circular cylinder was performed at the conditions of an experimental study of Cantwell and Coles (“An Experimental Study of Entrainment and Transport in the Turbulent Near Wake of a Circular Cylinder,” Journal of Fluid Mechanics, Vol. 136, 1983, pp. 321-374). The Reynolds number based on cylinder diameter was 1.4x10e5 and the inlet Mach number was 0.04. The simulation was performed using OVERFLOW, an unsteady, turbulent, 3-D, finite-difference flow solver.
Cantwell and Coles present measured Reynolds stresses in the wake in both the absolute reference frame and a reference frame that convects with the vortex street. The eventual goal of the current (ongoing) project is to determine the ability of the flow solver to duplicate the Reynolds stresses.
At the experimental Reynolds number, the flow is laminar over the cylinder, and goes through transition in the wake. In the initial simulation, no turbulence model was used. This will show the fraction of the Reynolds stresses that is attributable to mixing due to large-scale (resolved) eddys.
Numerical Method
An o-grid was used in the simulation, with dimensions of 401x101x301 (circumferential, along length of cylinder, and normal to surface respectively), for a total of approximately 12x10e6 grid points. An implicit, block tri-diagonal solver was used, with Roe differencing for the convective terms and central differences for the viscous terms. The outer edge of the domain was ten diameters from the cylinder. Characteristic boundary conditions were used at the outer edge, with the no-slip condition with zeroth-order extrapolation of pressure at the cylinder surface. Periodic boundary conditions were used at the remaining boundaries.
Computation
The simulation was performed on Boston University’s IBM Blue Gene computer using 256 processors. For this grid size, OVERFLOW would not use more than 256 processors because a heuristic within the code deduced that insufficient work would be performed on each processor, resulting in a poor parallel efficiency.
Each Blue Gene node has 512 MB memory and two processors. The Blue Gene can operate in the “coprocessor mode,” with only one processor used per node, or the “virtual node mode,” with both processors used on each node. In the virtual node mode each processor can access half of the node’s memory. Since more than 256 MB was required per processor in the current simulation, the coprocessor mode was used. Each time step required approximately 1.75 seconds wall-clock time.
Results
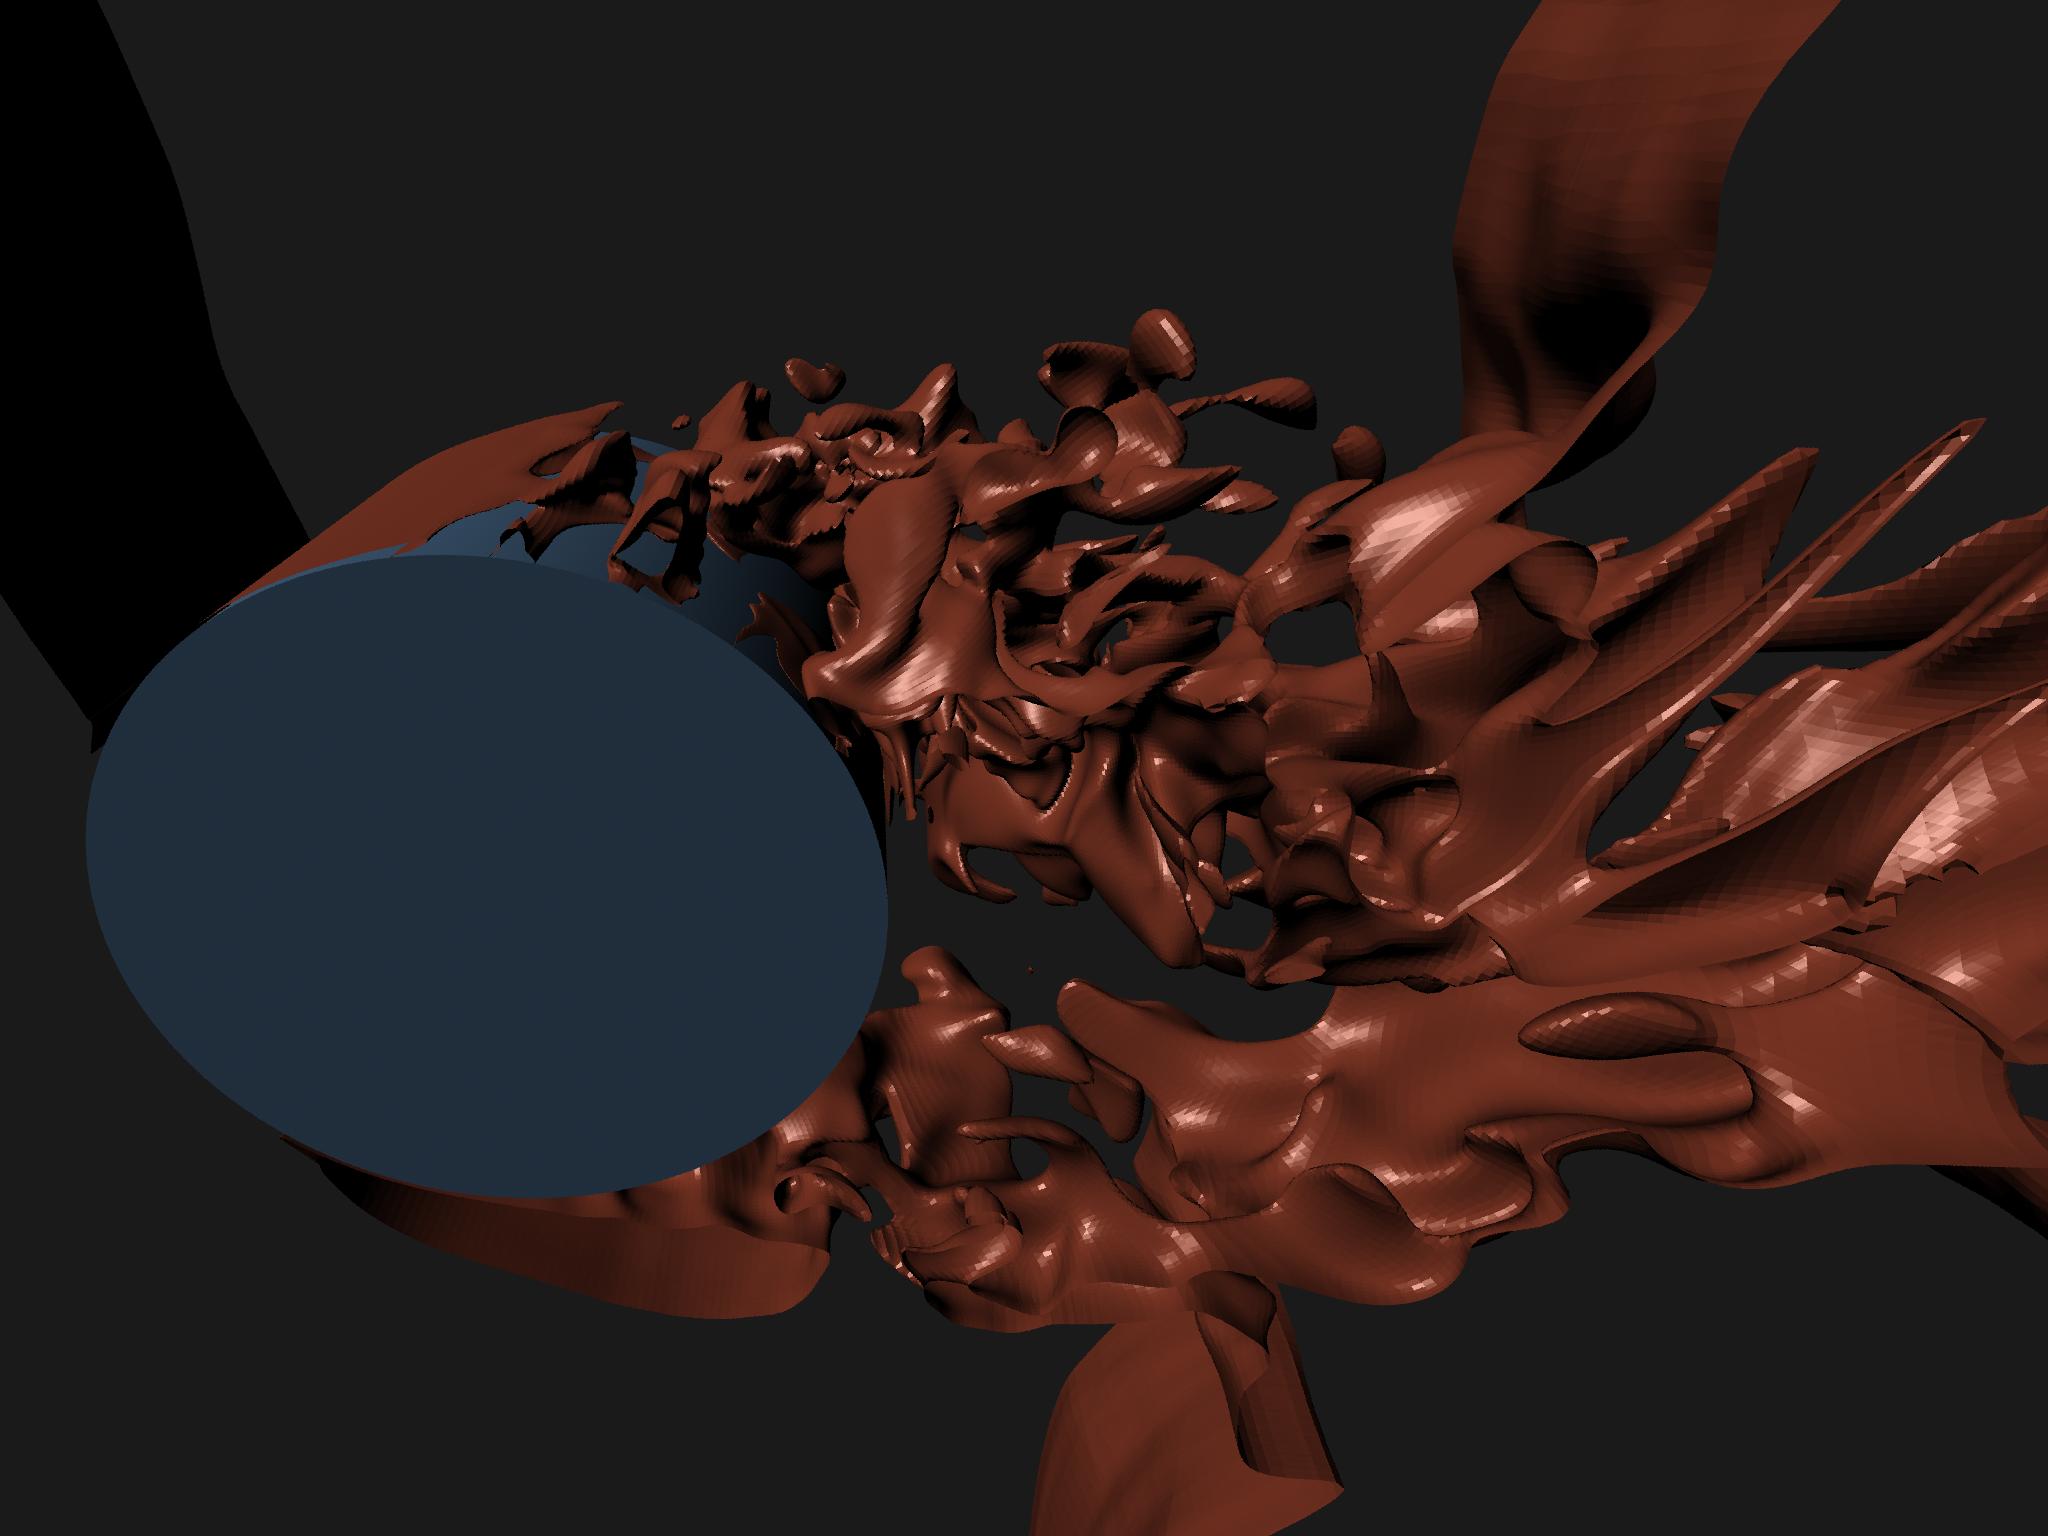
An instantaneous pressure isosurface is shown in Figure 1 (above). The laminar boundary layer separates, and a complex flow field results directly behind the cylinder. The vorticity in the near wake eventually rolls up into a vortex street beyond the domain of the figure.
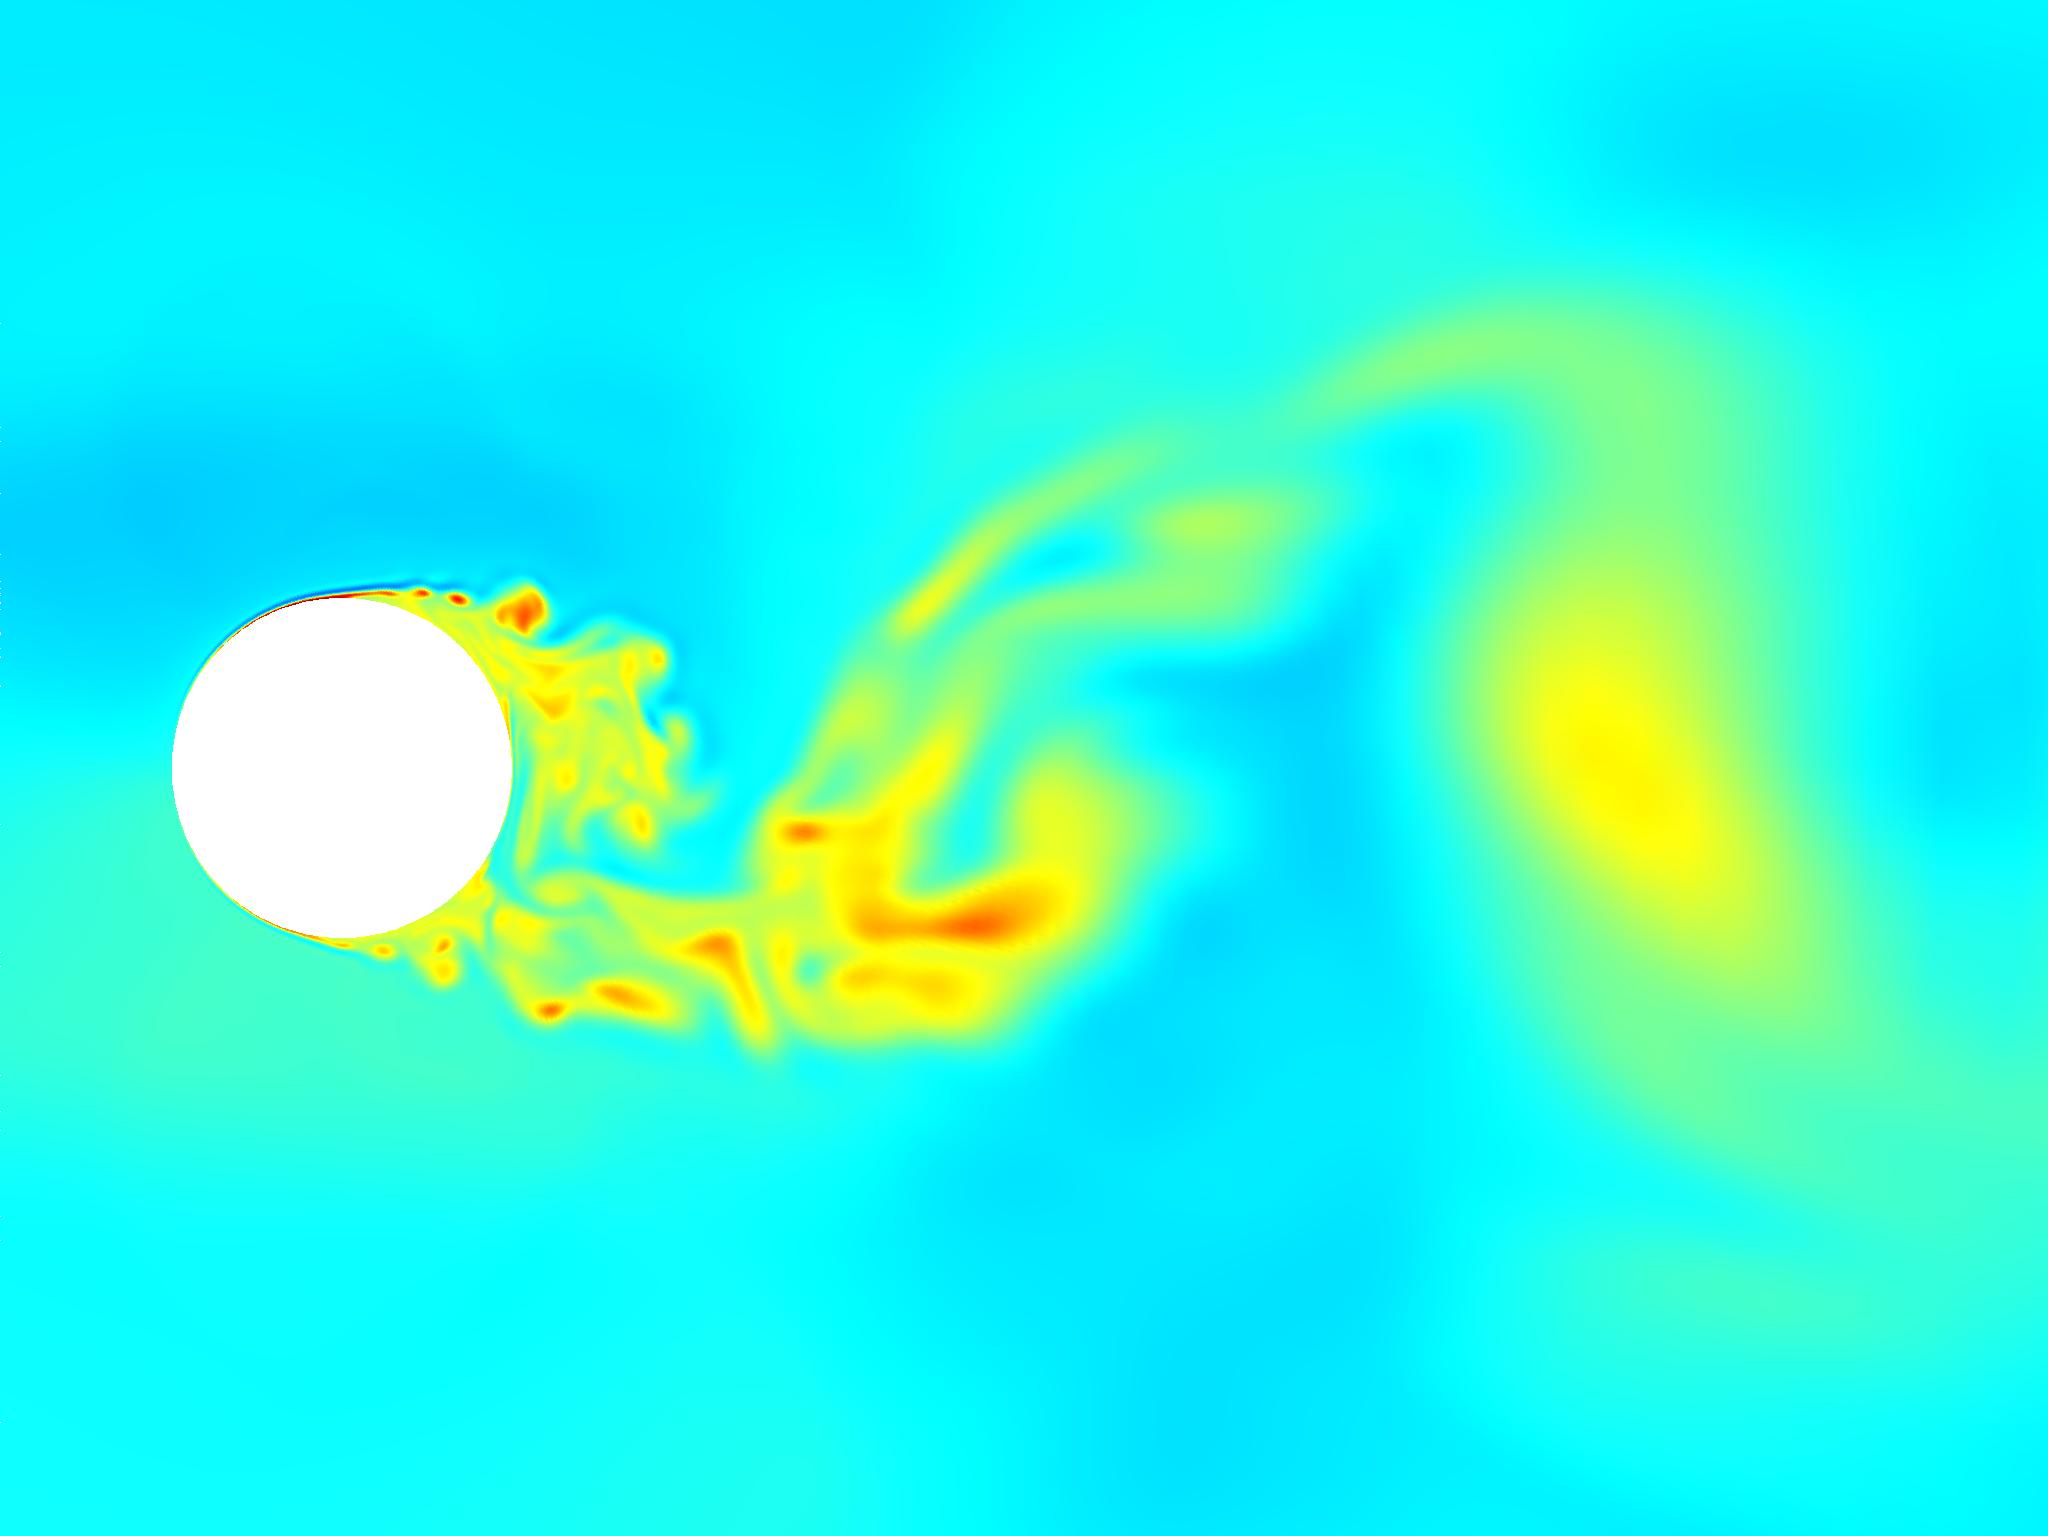
Figure 2 shows instantaneous contours of entropy at mid-span. In this view, small vortices can be observed just downstream of the separation point of the upper boundary layer. These “secondary vortices” have been observed in experimental studies (e.g., Wei, T., and Smith, C. R., “Secondary Vortices in the Wake of Circular Cylinders,” Journal of Fluid Mechanics, vol. 169, 1986, pp. 513-533). Approximately one diameter downstream, the secondary vortices that had shed from the lower boundary layer can be seen coalescing into the larger vortices of the vortex street.
Workflow Diagram
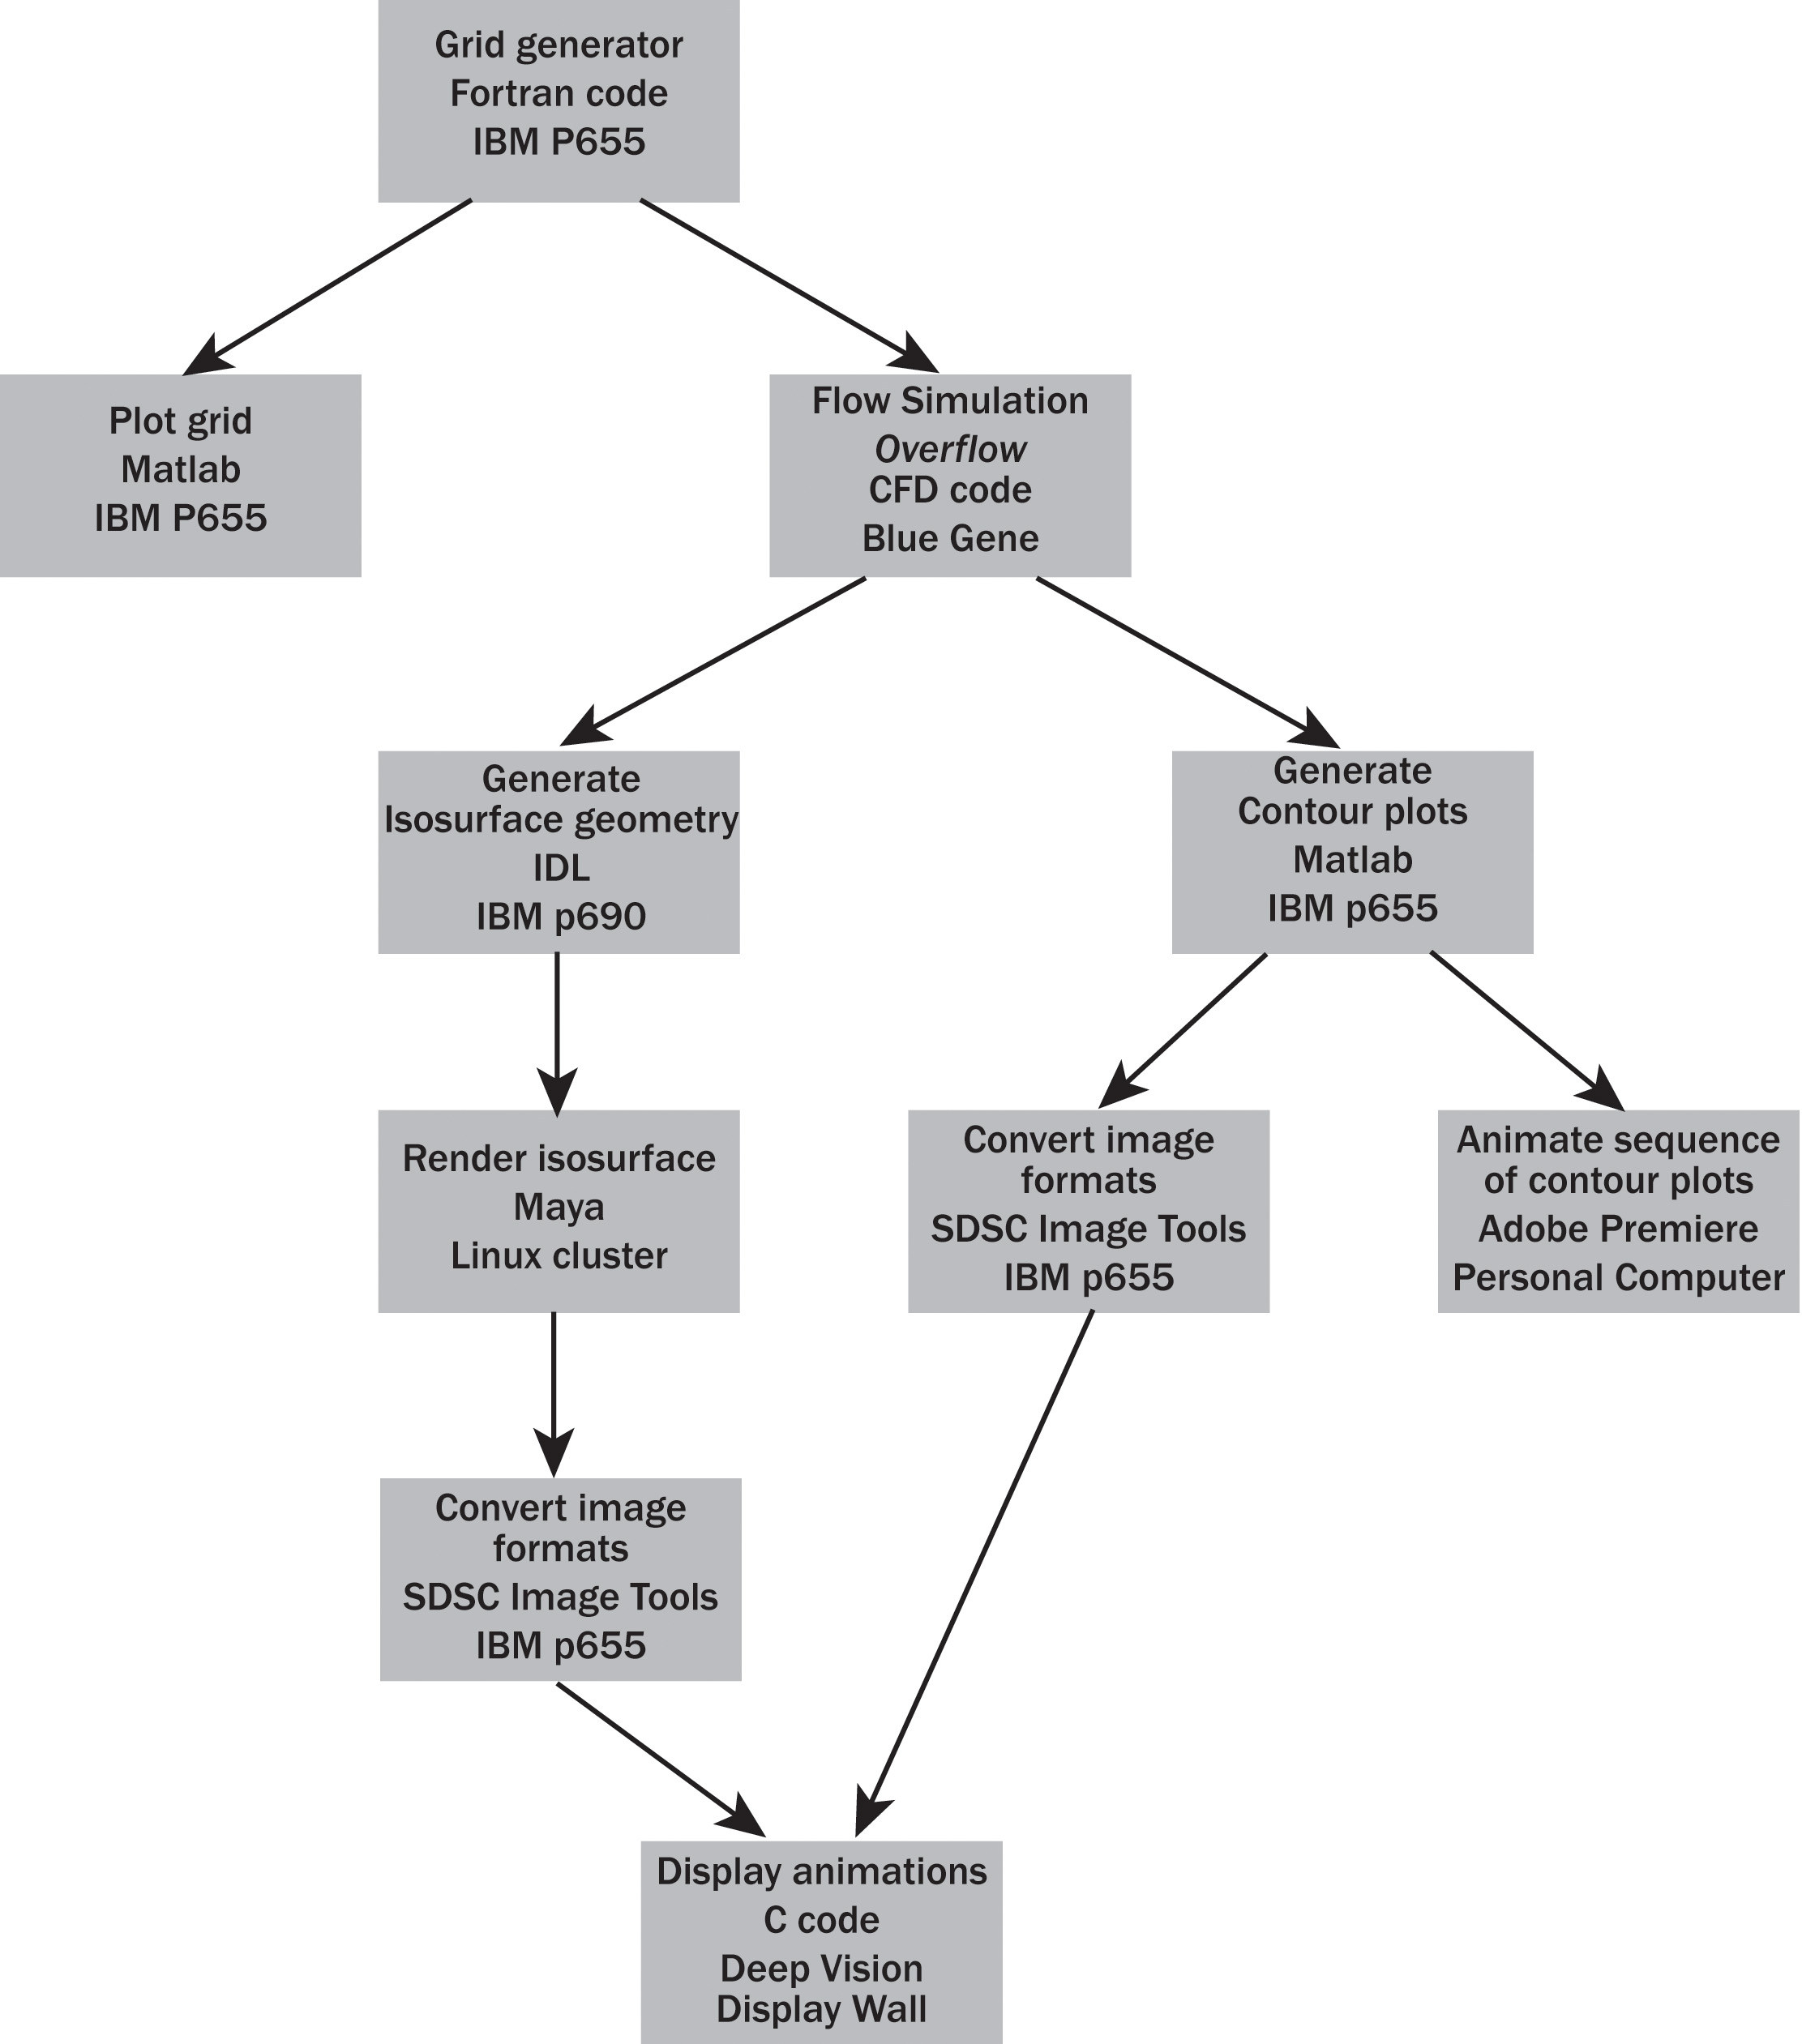
A large number of hardware and software resources were used to perform this simulation and create the associated graphics. The “Workflow Diagram” shown in Figure 3 illustrates the procedure.
Due to the simple geometry of this configuration, an algebraic grid generator was written in Fortran and run on a single processor of an 8-processor IBM p655. 2D grid sections were plotted using Matlab, also on the p655, to check for correctness. The grid file was then transferred to the 1024-node (2048-processor) Blue Gene, where the simulation was performed on 256 processors.
Initially, an OVERFLOW solution was arbitrarily saved every 100th time step. A Matlab program was written to create contour plots of entropy on a 2D surface of the solution normal to the axis of the cylinder (e.g., Fig. 2). The images were to be displayed on the Deep Vision Display Wall, requiring a resolution of 2048×1536. The images from the Matlab program were saved in tiff format, since this made it convenient to set the required resolution. An initial set of tiff images was transferred to a PC and animated using Adobe Premiere at 30 frames per second. Based on this initial animation, it was decided that a somewhat finer resolution would be preferred, so for the final product the OVERFLOW solutions were saved every 75th time step. San Diego Supercomputing Center’s Image Tools were used to convert the tiff files to the ppm format for use on the display wall.
In addition to the 2D contour plot movie, an animation of pressure isosurfaces was produced to show the changing 3D structure within the simulation. Each solution was processed using IDL to generate an isosurface at a fixed threshold. Since IDL does not have an isosurface function for handling curvilinear grids such as that on which the simulation was performed, and we did not wish to resample the data, this entailed developing a routine based on the existing IDL function to handle curvilinear grids. The resulting geometry was saved and converted into a file format which could be read by Maya. For each time step, Maya was used to generate a large image for each eye, using a camera with a symmetric frustum, at an over-wide resolution of 2088×1536. These were cropped using the Image Tools to produce the correct effect of an asymmetric frustum at a resolution of 2048×1536. The image format was also converted in this step to one which could be read by the movie processing program used for the Deep Vision Display Wall.
Vortex Shedding Movies
The movies below were originally shown in stereo on our traveling high-resolution stereo display at the Supercomputing 2005 conference at a resolution of 2048 x 1536. For the web versions here, they have been downsampled to 720 x 540 mono and are available in Microsoft AVI and Apple Quicktime formats. The Quicktime versions are of somewhat higher quality but are also around five times as large files.
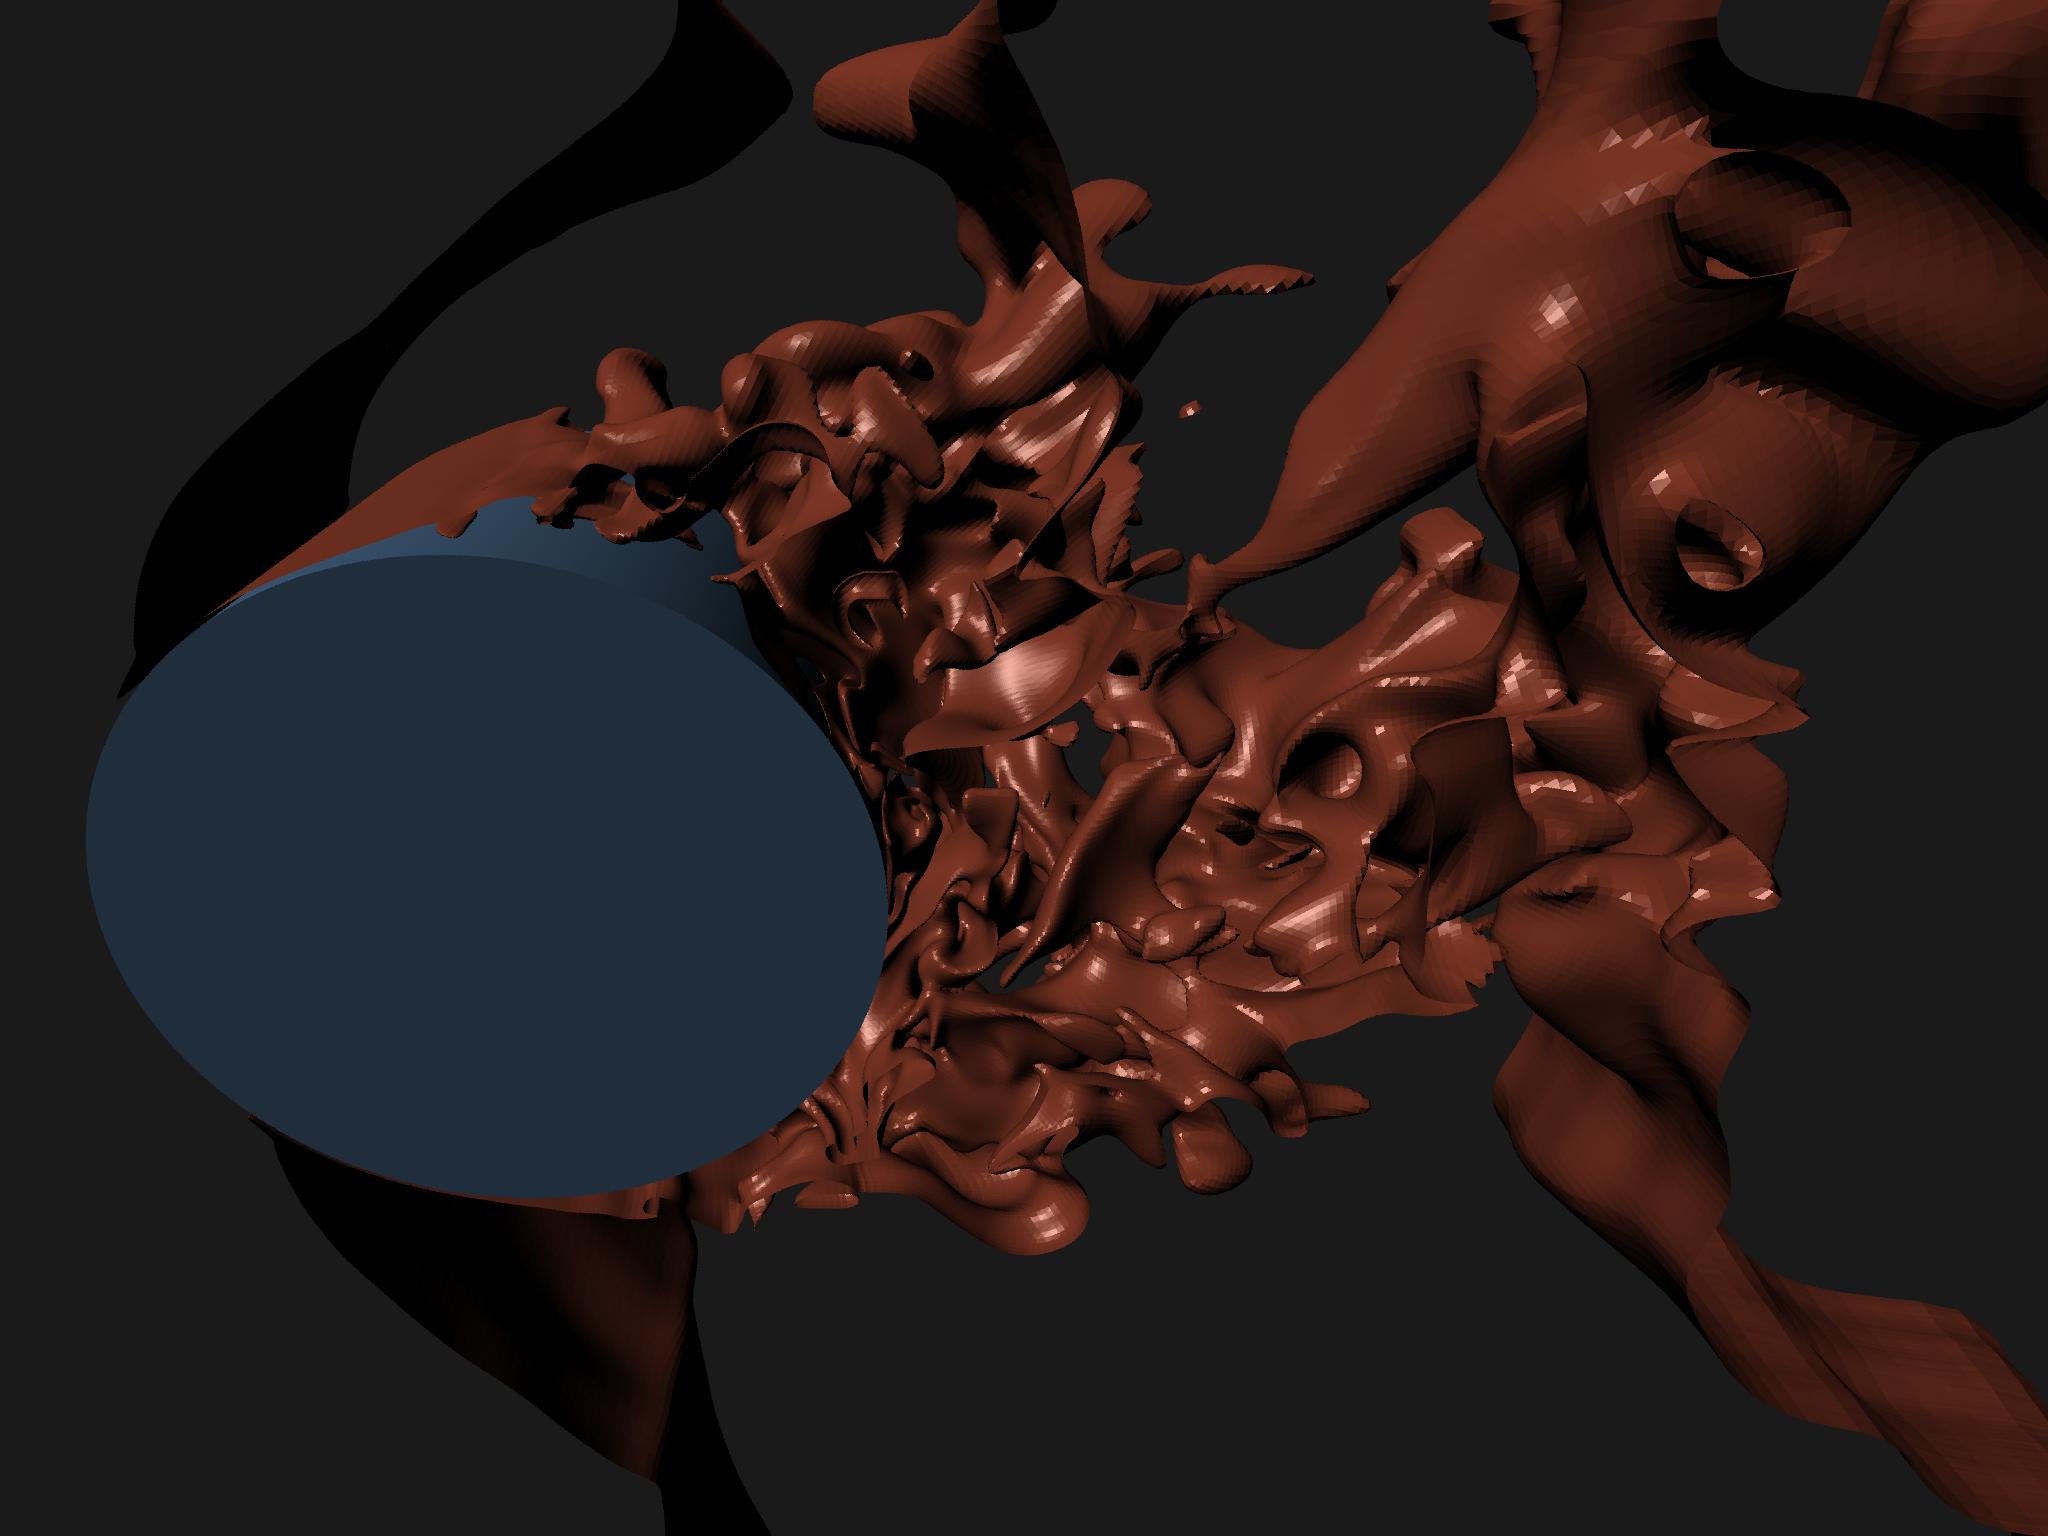
Pressure isosurfaces are shown for an unsteady, 3-D simulation of air flow over a circular cylinder at a Reynolds number of 140,000. There is a complex system of vorticity in the separated flow region behind the cylinder. There is a high level of structure in the direction of the cylinder axis, showing the limitations of 2-D simulations for this kind of flow field. The length in realtime of this animation is 0.79 seconds. (81MB AVI, 567MB QuickTime)
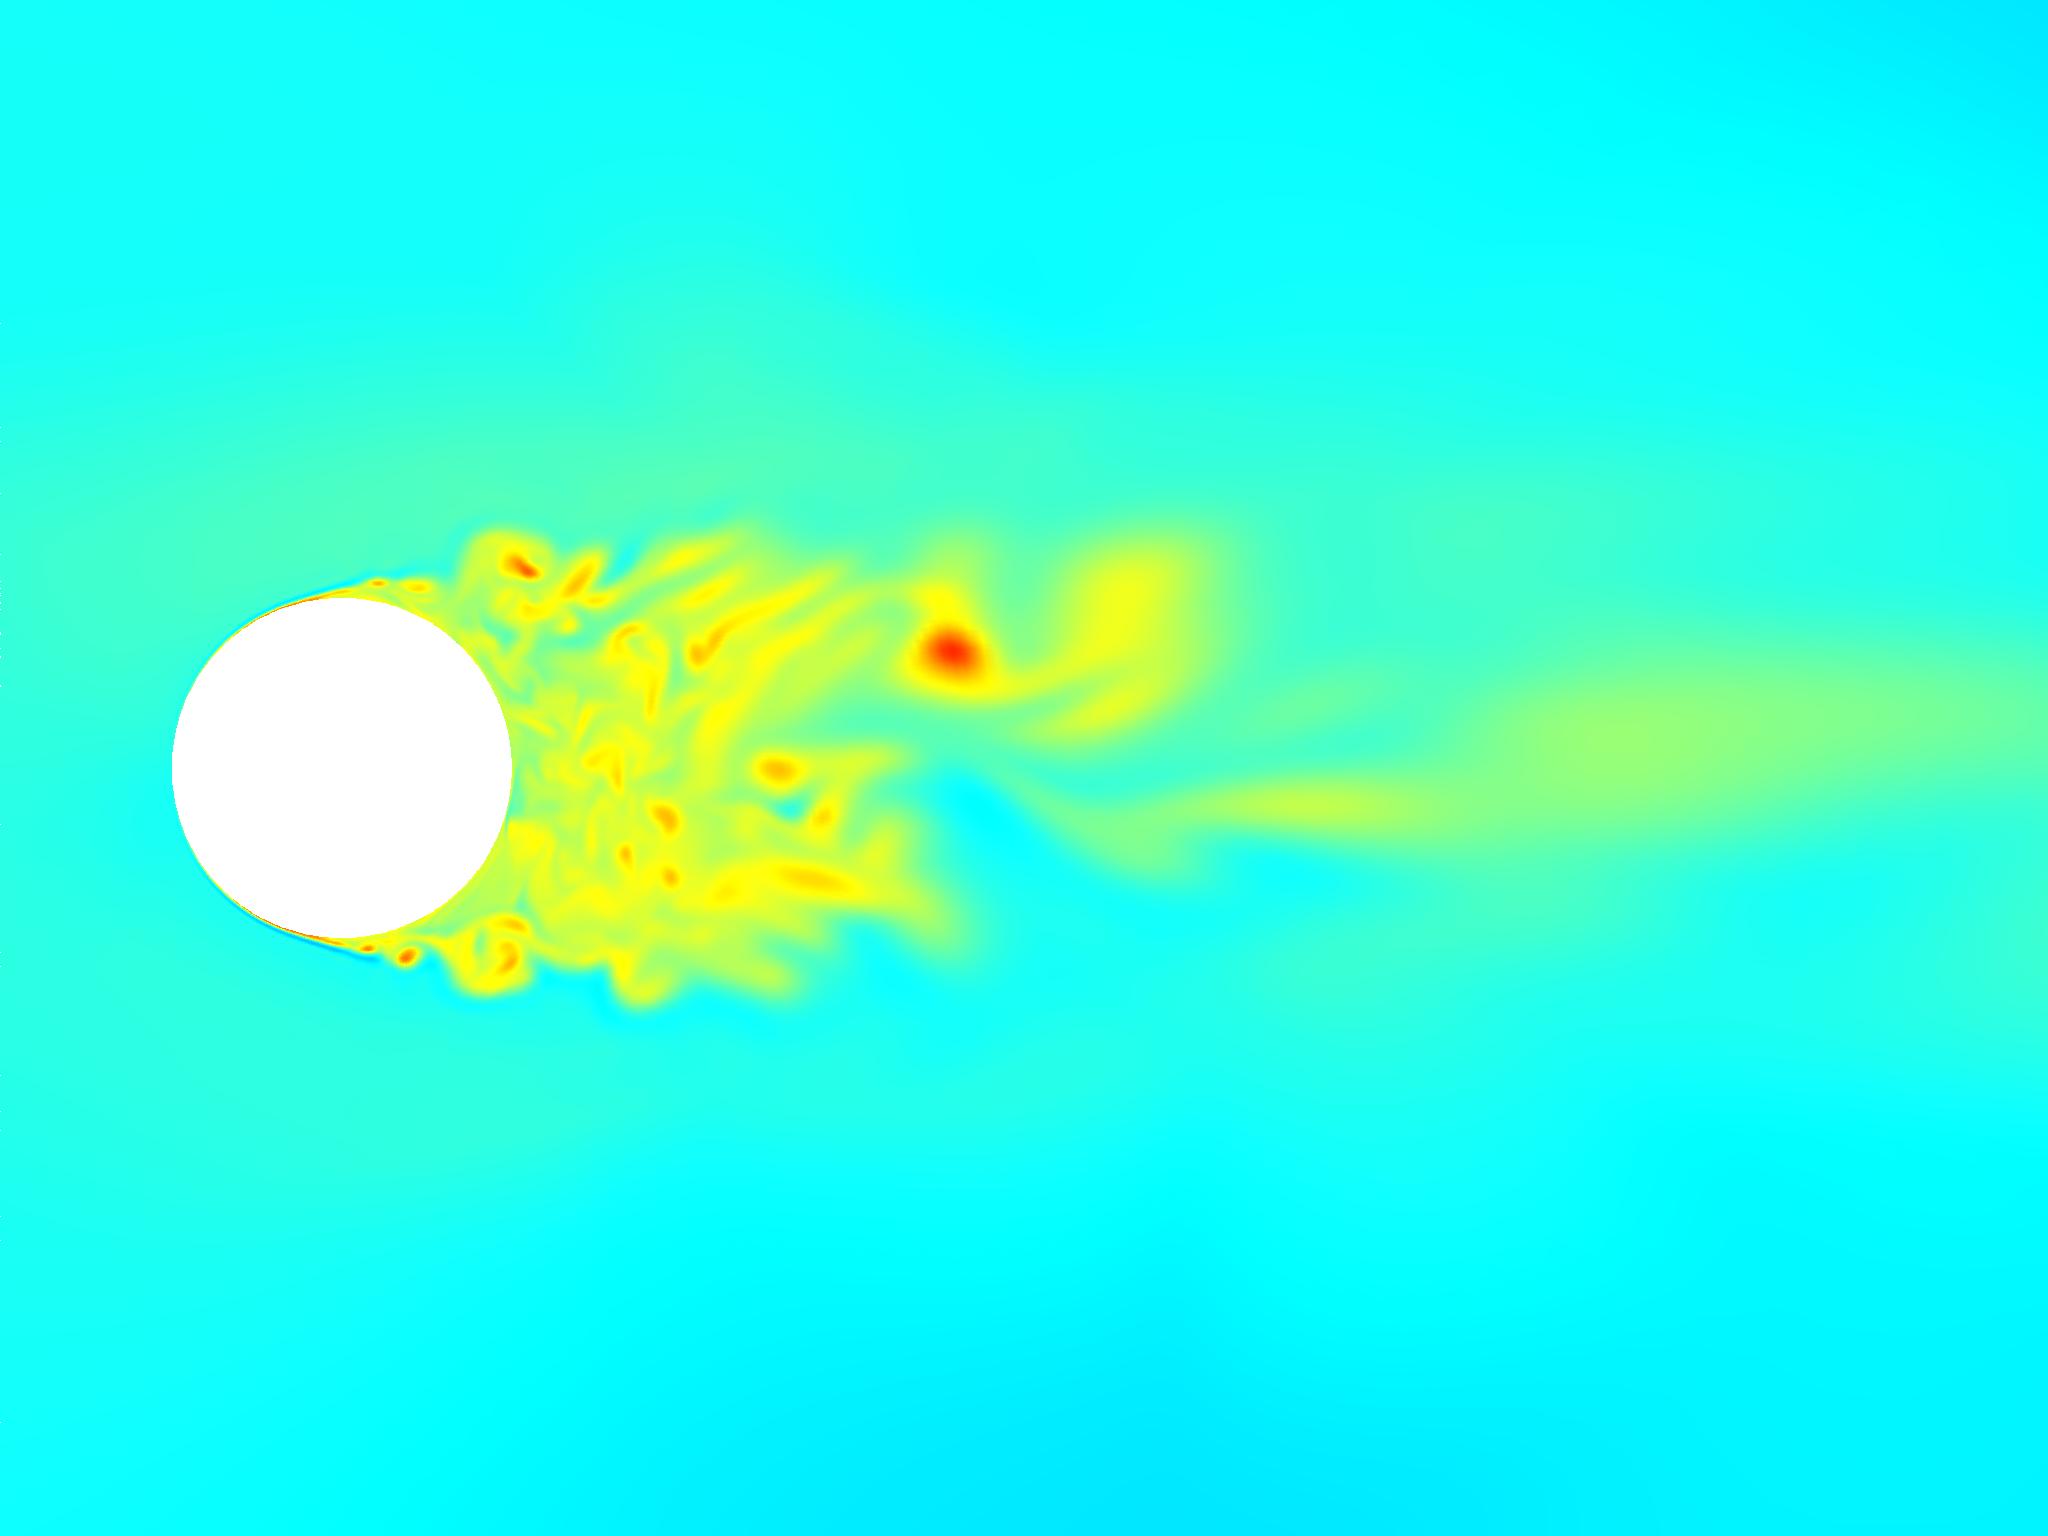
Entropy contours are shown for a 2-D, midspan slice of the 3-D cylinder flow simulation described above. Secondary vortices can be clearly identified shedding from the location where the boundary layer separates from the cylinder. These small vortices combine, forming a von Karman vortex street further downstream. The length in realtime of this animation is 2.02 seconds. (261MB AVI, 1.16GB QuickTime)