Mary Lulloff
Read the instructor’s introduction
Read the writer’s comments and bio
Download this essay
Abstract: Historically, economic recessions are synonymous with budget cuts in the American education sector, and these budget cuts, in turn, adversely affect both teachers and students. This paper contextualizes this idea by exploring the extent to which the 2008 Great Recession affected public schools. Graduation rates and standardized test scores across Arizona and Oklahoma show an overall decline in student achievement, which is heightened among minority students. Similarly, teacher salary statistics show further disadvantages during the recession. Additionally, I highlight the strengths and limitations of education policies that succeed 2008, to emphasize the dire need for reform that public schools faced because of the recession. Accordingly, this paper highlights the disadvantageous effects of the Great Recession on both teachers and students, and it simultaneously evaluates the boom in education policy that resulted.
It comes as no surprise that economic recessions in America affect the budget allocation for public schools, and this is true of the 2008 Great Recession. The Great Recession, beginning in December of 2007 and lasting until June 2009 (with ramifications lasting into present day), was a period of the largest economic decline in the United States since the Great Depression. As such, it corresponds to one of the most substantial decreases in the public education budget in recent decades. This paper investigates the extent to which economic recession affects public education, using the example of the Great Recession. Data investigating government spending to public education during the recession are utilized to measure specific consequences for teachers and students through a more focused lens. While the Great Recession caused widespread damage across the entire country, certain regions were hit harder “due to years of growth in residential areas before the recession” (Sanburn). Thus, this paper takes these differences into account and compares data from Arizona, a state that encountered huge disadvantages from the recession, to Oklahoma, which experienced a comparatively weak decline. Overall, the data point to collective negative impacts on teachers and students, with these effects intensified for minority groups; however, to attribute these effects to any recession, common factors such as funding disparities, geography, and labor unions must be considered.
Politicians responded to the Great Recession with policies such as the American Recovery and Reinvestment Act of 2009, which dedicated around $100 billion to public education. Not only did this funding jumpstart educational programs such as Head Start and Race to the Top, but it aimed to finance low-income school districts, teacher salaries, and federal Pell Grants, among other programs (Department of Education 1). Here, I briefly address the success of policies like these in lessening or reversing adverse effects of the recession on public education.
Literature Review
A vast range of literature explores the implications of the Great Recession on several different social and economic factors: unemployment, poverty, homelessness, income, etc. However, the prevalence of relevant research appears to narrow under the scope of public education. This paper uses the Great Recession to suggest trends for the effects of economic recession in general. Little to no prior literature explores the theoretical effects of a nonspecific economic recession, in part due to the multifaceted nature of recessions that vary largely from case to case. Because of these factors, most research relevant to this paper is subsequent to 2008.
The majority of research surrounding education and recession focuses on higher education, while information regarding public primary and secondary education is fairly refined to the importance of government spending on the education system. This debate is not new; however, considering the effects of the Great Recession on public education funding is imperative, because controversy surrounds the topic. Though, most research concludes that “students that [experience] reduced public school spending [have] both lower test scores and lower high school completion rates” (Jackson 21). Specific researchers, such as Kirabo Jackson in his economic analysis “Do School Spending Cuts Matter? Evidence from the Great Recession,” also use data from the Great Recession, which support claims made in this paper. While Jackson’s analysis does review factors such as free or reduced lunch status, it fails to adequately address additional disparities in student success between different minorities. Kenneth Shores and Matthew Steinberg’s paper “The Impact of the Great Recession on Student Achievement: Evidence from Population Data” is more analytical in this regard, yet does not examine the role of geographic location.
Research into the effects on teachers is even more sparse, and what exists is fairly broad. For example, in their report “The Recession’s Impact on Teacher Salaries,” Ginger Moored and Valerie Franck simply conclude “There’s no doubt that the recession had a measurable impact on teacher salaries…nearly every district in our sample slowed the pace of teacher salary growth in response to the economic downturn” (Moored and Frank 11). This simple deduction offers little analysis on the Great Recession’s impact on teachers, while this paper attempts to more critically identify nuances that contributed to the evident decline in teacher salary growth.
Historic Background
In two historic periods of economic recession in the United States, the 1930s and the 1970s, data from the height of each recession as well as emergent policy vary greatly, and are dependent on several factors. These contexts are necessary to explore in order to gain an understanding of the different factors that influence shifts in public education during a period of recession. These two cases show that patterns between economic recession and education are based on a myriad of circumstances and therefore their effects are elusive; however, analyzing common contributing factors yields insight to wider trends.
Throughout the Great Depression in the 1930s, public school enrollment maintained stable growth, while many changes occurred in the forms of public attitude and education policy. David Tyack and Elisabeth Hansot model that high school dropout rates steadily decreased throughout the 1930s and, “in comparison with the private economy, which experienced great upheavals, public schooling remained remarkably stable in funding and continued its long-term trend of institutional expansion” (Tyack and Hansot 35). Even with a decline in birth rate, rising enrollment (particularly at the secondary level) corresponded to a surge in the number of school-age children. Additionally, public schools were not guaranteed federal funding until the passage of the Elementary and Secondary Education Act (ESEA) of 1965, meaning that decreasing education funding was not an option for the federal government in combating the growing deficit of the Great Depression. Therefore, such disturbances were minimal in public schools during 1930s. In addition, labor unions, such as the National Education Association, that emerged in the early years of the Depression were extremely successful in publicizing the benefits of public schools to boost morale and thus creating a consensus that education is of utmost importance, even during the Great Depression (Tyack and Hansot 38–39).
On the other hand, education policy resulting from the Great Depression (primarily through Roosevelt’s New Deal) was thought of as only secondary in importance to economic revival, and therefore effects were lackluster. New Deal initiatives such as the Civilian Conservation Corps (CCC), National Youth Administration (NYA), and Works Progress Administration (WPA) provided a range of educational opportunities, yet the “impetus for the educational initiatives of the New Deal came principally from the need to tide people over and put them back to work” (Kantor and Lowe 5). The educational benefits of the New Deal programs did not prevail after revival of the economy was achieved; thus, Roosevelt missed an apparent opportunity to strengthen the public education system to defend against future recessions.
Circumstances differed during the recession of the 1970s, and it is important to first contextualize the education policy of the previous decade to elaborate on the effects of this recession. Public attitude towards education shifted during the Kennedy and Johnson administrations, particularly in the Great Society era, with legislation such as the Elementary and Secondary Education Act (ESEA) and Title I. Johnson created these programs as part of his “war on poverty,” and they did successfully produce gains in achievement among minority students (Kantor and Lowe 8). Johnson sparked a social change that represents a key factor in the development of a federal commitment in education policy. In addition, the importance of equal education was emphasized with the Civil Rights Movement. These factors interacted together to spark government involvement in public education and create an increasing reliance on federal funding, which amplified the shock felt by public schools in response to the 1970s recession.
Fiscal policy during the 1970s recession played a stronger role in public education and created uncertainty regarding education. The recession coincided with a massive decline in enrollment, due in part to the ending of the baby boom of the previous decade. This decline had conflicting effects for different school districts; the wealthy profited from smaller class sizes and a surplus of teachers, while the local finance in other districts suffered because of cuts in state funds (Tyack and Hansot 43). Overall, the enrollment drop added to the fiscal strain in public schools at the time, since federal funding was dependent on the size of a school. In the 1970s, enrollment decline did have measurable educational impacts, but the same cannot necessarily be said of the increase in the 1930s; a rise in enrollment is a notable circumstance of the Depression, but did not cause any particular achievements. Additionally, economic fluctuation in the 1970s left many with high property taxes, and consequently, the passage of Proposition 13 limited property taxes and caused tax revenue to fall significantly. Therefore, “the tax and spending caps not only hastened retrenchment—already under way because of declining enrollments, inflation, and local resistance to bond levies—but also deepened a sense of vulnerability among educators” (Tyack and Hansot 48). While the 1970s recession was prefaced with Johnson’s beneficial education policies, decreases in both tax revenue and student enrollment during the recession contributed to the onset of new financial problems for public education.
Completely different educational circumstances during the declines of the 1930s and 1970s show the difficulties in pinpointing how education suffers during a recession, due to the involvement of many factors, including soft data like public attitude and social belief. Historically, public education survived numerous periods of economic decline, in part because of its embeddedness in American society. This sets up a clean slate for exploration into the Great Recession, because, leading up to 2008, public education only became more so embedded in American life.
Methodology
This paper employs primarily qualitative methods to measure the effect of the Great Recession on teachers and students. I obtain published data from the National Center for Education Statistics (NCES) from four different academic years: 2006–2007, 2007–2008, 2008–2009, and 2009–2010 to measure changes immediately before, during, and immediately following the recession. Analysis is conducted through an economic lens; however, historical context is provided for further comparison.
First, I address federal and state funding during these years to establish baseline trends that allow for justification of nuances presented in additional datasets. For the indicated academic years, I measure the effects on students through two categories: elementary and secondary education. For elementary education, I utilize data regarding fourth grade reading scale rates to judge achievement, while for secondary education, I reference high school dropout rates. Then, I turn to the effects on teachers by observing teacher salaries in both elementary and secondary education.
In reviewing this data, I draw comparisons between the states of Arizona and Oklahoma. Economically, these states experienced different degrees of hardship during the recession because of differing levels of residential growth. Both states also show comparable average teacher salary and average spending-per-pupil rates prior to the recession, allowing for closer isolation of the variable of geographic location. Furthermore, all data are collected from a state-wide perspective; distinct school districts are not considered, allowing for broad analysis of the role of geography rather than emphasis of disproportionate funding between urban and suburban schools.
In past recessions, enrollment rates and the number of school-age children corresponded to specific consequences for education; however, this factor is not strongly considered here. From 2003 to 2008, enrollment grew by 1.5% nationally, with both Arizona and Oklahoma showing rates above the national average (NCES Table 34). While decreases in enrollment may perpetuate further economic decline among schools during a recession, significant economic implications will not occur because of normal enrollment growth. Enrollment reflects not only changes in birth rate, but also migration of families with school-age children, and historically, changes in the number of school-age children are not effects of recession, but rather circumstances that need not be analyzed in this instance.
For this level of generic economic analysis, it is impossible to control all variables. For consistency and for insurance of similar data collection methods, I confine myself to data strictly from the National Center for Education Statistics (NCES). In the case of reading scale rates, the data from NCES are collected biannually, leaving more gaps than in other areas. The same data also only measure scale rates for white, black, and Hispanic students; other races and ethnicities are neglected in this data set because the NCES did not meet all necessary reporting standards. The analysis is therefore intended solely to describe possibilities that may stem from periods of economic decline.
Results and Analysis:
- I. Per-Pupil Spending

Figure 1. Per-pupil spending, using 2011–2012 dollars (NCES Table 218)
The data above exemplifies that Oklahoma experienced steady increases in per-pupil spending, with a larger increase following the 2007–2008 academic year, in the height of the recession. On the other hand, Arizona experienced an initial increase between the 2006–2007 and the 2007–2008 academic years, but then saw a decline in the following year, as the recession progressed. In the succeeding year, spending increased again. This episode establishes an expectation: during an economic recession, spending diminishes at greater rates in those states where the effects of recession are endured more strongly. This trend serves as a basis for analysis of specific effects on teachers and students, such as declines in test scores and teacher salary, and increases in dropout rate.
- II. Elementary Education: Fourth Grade Reading Scale Rates
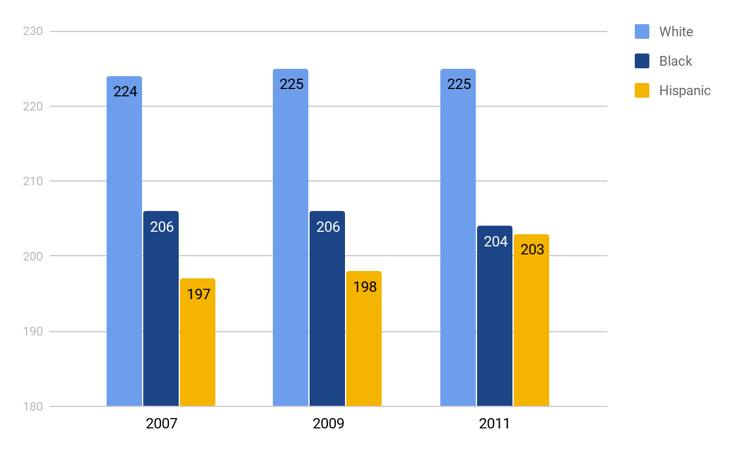
Figure 2. Arizona Fourth Grade Reading Scale Rates, based on a 0–500 scale (NCES Table 116, 129, 131)
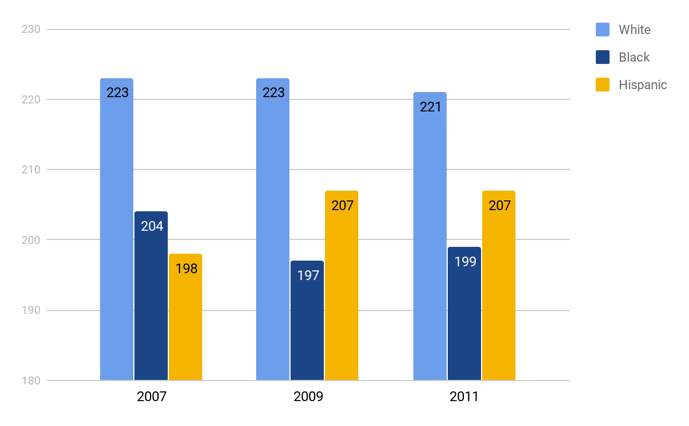
Figure 3. Oklahoma Fourth Grade Reading Scale Rates, based on a 0–500 scale (NCES Table 116, 129, 131)
According to Figures 2 and 3, the scores of white students in both states remain almost constant, while black and Hispanic students show more variation in their scores. Specifically, between 2007 and 2009, black students’ scores remain stable in Arizona but fall drastically in Oklahoma. For the same year, Hispanic students show gains in both states, though the result is sharper in Oklahoma. In the following year, the scores of black students fall slightly in Arizona, while the scores of Hispanic students illustrate a significant increase. The inverse is true of Oklahoma: black students scores boost by two points, yet the scores of Hispanic students do not fluctuate.
These data suggest that students of color display higher sensitivity to funding changes. Scores of white students remained essentially consistent in both states, although Hispanic and black students demonstrate more fluctuation, both in the positive and negative direction. This trend can be attributed to funding variations across the United States; schools with larger populations of students of color consistently receive less funding. In Arizona, predominantly nonwhite schools receive 46% less funding than predominantly white schools, and in Oklahoma, nonwhite schools receive 30% less (23 Billion). These vast differences in funding equate to noticeable differences in student achievement between different groups of students, as evidenced by Figures 2 and 3.
The amounts by which scores differ between years in both states do not show major disparities, meaning that geographic location is not as influential as funding to this issue. Additionally, from 2007 to 2011, white and Hispanic students in both states show a net gain in reading scores, and only black students show a net loss, which is greater in Oklahoma, despite consistent per-pupil spending throughout the recession. Although all groups in both states incurred fluctuations, black students were ultimately most afflicted by the recession in primary education, with geographic location carrying little influence.
- III. Secondary Education: Dropout Rates
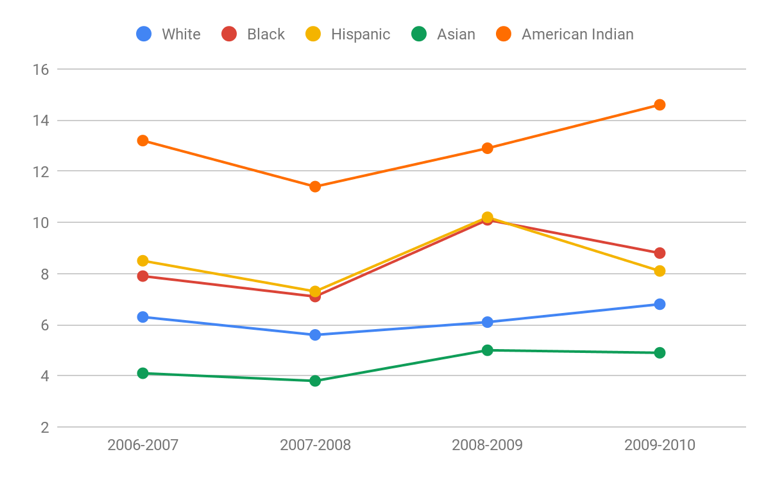
Figure 4. Arizona Dropout Rates, measured in percent (NCES Table 106, 113, 114, 126)

Figure 5. Oklahoma Dropout Rates, measured in percent (NCES Table 106, 113, 114, 126)
The data in Figures 4 and 5 exemplify that not only do students in Arizona consistently show higher high school dropout rates, but the variation between different racial and ethnic groups is also much more extreme. According to Figure 4, from the academic year 2007–2008 to 2008–2009, rates for all groups rose in Arizona, but the surge is steeper among students of color. In the following year, the data becomes sporadic; white and American Indian students experience persistent increases, while black and Hispanic students model decreases, and Asian students’ rates remained constant. Meanwhile, for Oklahoma, Figure 5 shows a contradictory trend for the same year. During the recession, dropout rates fell, especially for Hispanic students. The data indicate that prior to the recession, both Oklahoma and Arizona dropout rates were declining. For Oklahoma, this trend continued through and after the recession, while for Arizona, the start of the recession corresponds to an uncharacteristic increase in dropout rates. The most notable data in this set pertain to the changes between the 2007–2008 and 2008–2009 school years; this period reflects the height of the recession. Recall that during this time, Arizona’s per-pupil spending decreased, while Oklahoma’s increased. Here, spending shows an inverse relationship to dropout rates.
- IV. Teacher Salary

Figure 6. Teacher Salary (NCES Table 79, 84)
According to Figure 6, throughout all four school years, salaries for Oklahoma teachers rose even after the start of the recession, when the rate of salary growth decreased. In Arizona, however, the rate increased immediately with the onset of the recession, but then decreased dramatically in the year 2009–2010. Arizona’s salaries decreased so dramatically that the originally-lower Oklahoma salary rate eventually surpassed Arizona’s. Contrary to the student data, these effects appear in the aftermath of the recession rather than during its emergence. The figure suggests that average salary behaves similarly with per-pupil spending in Oklahoma, yet dissimilarly in Arizona, thus showing that these variables are independent of geography.
Rather, the reason for this discrepancy is the comparative strength of unions in Arizona and Oklahoma. A 2012 Fordham Institute report concludes that Arizona’s unions are the weakest in the nation, considering that “state law limits the unions’ power to strike and gather revenue, supports charter school expansion, and does not offer teachers many of the job securities seen in other states” (Northern et. al. 2). Oklahoma teacher unions rank above Arizona, although still in the latter fifth of the nation, as they “claim only limited membership and financial resources, few favorable policies at the state level, and a relatively weak reputation among stakeholders” (Northern et. al. 2). Robust teacher unions suggest an ability to withstand or prevent negative economic impacts of a recession on teacher salaries. While neither state ranks relatively well, Oklahoma’s comparative advantage partially explains the state’s continuous teacher salary growth beyond 2008.
- V. Outcomes
Ultimately, the Great Recession teaches several lessons about the educational outcomes of recession in Arizona and Oklahoma; namely that students show sensitivities to fluctuations in per-pupil spending, which reflect in measures of their achievement, while the magnitude of effects on teachers more so depends on labor unions. Susceptibility is amplified among students of color because in addition to funding disparities at the state level, they experience further inequality at the district level, considering many students of color are concentrated in urban schools that unanimously receive less aid and attention than their suburban counterparts. Furthermore, repercussions appear almost immediately for students yet take time to manifest for teachers, but without intervention, effects remain prominent in the long-run for the two groups.
In both states, the Great Recession initiated unexpected changes in funding with visible implications; however, geography also plays a role in the character of these implications. Specifically, Arizona, which experienced a period of drastic improvement in per-pupil spending from 2006 to 2007, was severely stunted in this sense by the recession, largely because it suffered the worst economically due to residential expansion prior to 2008. Consequently, graduation rates fell excessively. To this end, other effects, primarily teacher salary, are less constrained by geographic factors. Dominant teacher unions are typically present in states less affected by the recession, so the two variables can be correlated; however, to say that geography is the sole generator of shifts in teacher salary undermines the efforts and nuances of labor unions.
Although each recession stems from a unique combination of economic circumstances, lessons from 2008 pertain to the expansive connection between education and recession. The educational ramifications of the Great Recession link back to common factors such as funding and geography; thus, it is essential to analyze these when predicting or reflecting on the outcomes of recessions. Decreases in funding correlate to adverse effects for teachers and students, especially in areas targeted worse during economic decline.
Implications
To combat recession, governments often respond by increasing spending to stimulate the economy. In response to the Great Recession, this increase in spending took the form of the American Recovery and Reinvestment Act of 2009 (ARRA). For the economy as a whole, the ARRA was an attempt to “raise GDP and increase employment by adding to aggregate demand and thereby boosting the utilization of labor and capital that would otherwise be unused because the economy is in recession” (Elmendorf 1). For education, this meant that the ARRA included approximately $100 billion in investments to public education. Most notably, the ARRA initiated programs such as the State Fiscal Stabilization Fund (SFSF), the Teacher Incentive Recovery Fund Plan, the Impact Aid Construction Recovery Plan, and Race to the Top, though it also built upon existing programs such as Title I and IDEA (Department of Education 1). The initiation of or additions to such programs left teachers and students better off in some ways, yet simultaneously presented them with a whole new set of challenges.
The State Fiscal Stabilization Fund invested nearly $50 million in preventing teacher layoffs, modernizing classrooms through technology, advocating for student enrollment in rigorous courses, and training teachers and school administration, among other tasks (Department of Education 21). Particularly for teachers, the SFSF invested in jobs that would have otherwise been demolished by the recession. While previous data point to a decline in teacher salary in states affected most during the recession, the SFSF was effective in softening these effects. This program, one of the more substantial constituents of the ARRA’s funds towards education, was an effective attempt at educational improvement for both students and teachers. Similarly, the ARRA focused on job-based motivations to restore the economy with programs like the Impact Aid Construction Recovery Plan, which created jobs to construct and renovate schools (Department of Education 33). In addition, the improvement of programs such as Title I and IDEA also left disadvantaged students better off than before and during the recession. Specifically, IDEA Special Education Recovery Grants Plan and the IDEA Special Education Preschool Grants Plan ensured quality education standards for children with disabilities that may not have otherwise been met in the absence of such programs. These benefits were extended to low-income schools and students with increased funds to Title I. ARRA funding to these programs granted students overwhelming benefits.
However, initiatives resulting from the recession such as the Teacher Incentive Recovery Fund Plan and Race to the Top both present comparable issues for civil rights and education. The two plans go hand in hand; Race to the Top creates higher incentives for the adoption of standard-based tests for student achievement, while the Teacher Incentive Recovery Fund plan uses these tests scores to create performance-based compensation systems for educators. These plans preach effectiveness in “increasing teacher effectiveness and achieving equity in teacher distribution, and turning around our lowest-achieving schools” (Department of Education 25). In doing so, quality of education decreases significantly as teachers “teach for the test” because their compensation relies on it. Nuances in different learning styles of students are disregarded and attention to material not evaluated on standardized tests (arts, social sciences, physical education, etc.) declines dramatically. Justification for these plans rests under the guise of accountability; having measurable data through test scores increases accountability, theoretically improving trust of the education system. However, accountability comes at a cost that leaves both students and teachers worse off, and is therefore a failure of the American Reinvestment and Recovery Act of 2009.
The American Reinvestment and Recovery Act, while multifaceted, was only one implication of the Great Recession, and it indicates that the impacts of 2008 cannot be ignored. Although the United States is no longer in the depths of the recession, its detrimental effects in the educational sphere, particularly regarding student achievement and teacher salary, are still taking shape. While the ARRA was effective in resolving several resounding issues faced by students and teachers, it stunted progress in other (equally important) areas, which are necessary to consider in evaluating the current state of the American public education system.
Works Cited
Department of Education Recovery Plan. Department of Education, 2009. U.S. Department of Education, www2.ed.gov/policy/gen/leg/recovery/recovery-plans-2010.pdf. Accessed 9 Apr. 2019.
Griffith, Michael. “How The Great Recession Impacted Teacher Pay.” EdNote, Education Commission of the States, 14 Dec. 2016, ednote.ecs.org/how-the-great-recession-impacted-teacher-pay/. Accessed 22 Mar. 2019.
Jackson, Kirabo, et al. “Do School Spending Cuts Matter? Evidence from the Great Recession.” 2018. Bepress, works.bepress.com/c_kirabo_jackson/35/. Accessed 22 Mar. 2019. Working paper.
Kantor, Harvey, and Robert Lowe. “Class, Race, and the Emergence of Federal Education Policy: From the New Deal to the Great Society.” Educational Researcher, Vol. 24, No. 3, Apr. 1995. Accessed 4 Apr. 2019.
Long, Bridget Terry. “The Financial Crisis and College Enrollment: How Have Students and Their Families Responded?” How the Financial Crisis and Great Recession Affected Higher Education, edited by Jeffrey R. Brown and Caroline M. Hoxby, PDF ed., Chicago, University of Chicago Press, 2014, pp. 209–233.
Moored, Ginger, and Valerie Franck. The Recession’s Impact on Teacher Salaries. May 2013. National Council on Teacher Quality, www.nctq.org/dmsView/The_Recessions_Impact_On_Teacher_Salaries_NCTQ_Report. Accessed 3 Apr. 2019.
Northern, Amber M., et al. “How Strong Are U.S. Teacher Unions? A State-By-State Comparison.” Thomas B. Fordham Institute, 29 Oct. 2012, fordhaminstitute.org/national/research/how-strong-are-us-teacher-unions-state-state-comparison. Accessed 18 Apr. 2019.
Sanburn, Josh. “These 3 Maps Show Where the Great Recession Hit Hardest.” Time 3 Dec. 2015. https://time.com/4133963/us-census-poverty-income-great-recession/
Shores, Kenneth, and Matthew Steinberg. “The Impact of the Great Recession on Student Achievement: Evidence from Population Data.” 28 Aug. 2017. SSRN, papers.ssrn.com/sol3/papers.cfm?abstract_id=3026151. Accessed 22 Mar. 2019. Working paper.
Table 34. Enrollment in public elementary and secondary schools, by state or jurisdiction: Selected years, fall 1990 through fall 2009. 2009. National Center for Education Statistics, U.S. Department of Education. Accessed 19 Apr. 2019. Table.
Table 79. Estimated average annual salary of teachers in public elementary and secondary schools, by state or jurisdiction: Selected years, 1969–70 through 2008–09. 2009. National Center for Education Statistics, U.S. Department of Education. Accessed 5 Apr. 2019. Table.
Table 84. Estimated average annual salary of teachers in public elementary and secondary schools, by state: Selected years, 1969–70 through 2010–11. 2011. National Center for Education Statistics, U.S. Department of Education. Accessed 5 Apr. 2019. Table.
Table 106. Public high school graduates and dropouts, by race/ethnicity and state or jurisdiction: 2006–07. 2009. National Center for Education Statistics, U.S. Department of Education. Accessed 5 Apr. 2019. Table.
Table 113. Public high school graduates and dropouts, by race/ethnicity and state or jurisdiction: 2007–08. 2010. National Center for Education Statistics, U.S. Department of Education. Accessed 5 Apr. 2019. Table.
Table 114. Public high school graduates and dropouts, by race/ethnicity and state or jurisdiction: 2008–09. 2011. National Center for Education Statistics, U.S. Department of Education. Accessed 5 Apr. 2019. Table.
Table 116. Average reading scale score and percentage of 4th-graders in public schools attaining reading achievement levels, by race/ethnicity and state or jurisdiction: Selected years, 1992 through 2007. 2007. National Center for Education Statistics, U.S. Department of Education. Accessed 5 Apr. 2019. Table.
Table 131. Average reading scale score and percentage of 4th-grade public school students, by race/ethnicity and state: 2011. 2011. National Center for Education Statistics, U.S. Department of Education. Accessed 5 Apr. 2019. Table.
Table 126. Number and percentage of 9th- to 12th-graders who dropped out of public schools, by race/ethnicity, grade, and state or jurisdiction: 2009–10. 2012. National Center for Education Statistics, U.S. Department of Education. Accessed 5 Apr. 2019. Table.
Table 129. Average reading scale score and percentage of 4th-graders in public schools attaining reading achievement levels, by race/ethnicity and state or jurisdiction: Selected years, 1992 through 2009. 2010. National Center for Education Statistics, U.S. Department of Education. Table.
Table 218. Current expenditure per pupil in average daily attendance in public elementary and secondary schools, by state or jurisdiction: Selected years, 1969–70 through 2009–10. 2012. National Center for Education Statistics, U.S. Department of Education. Accessed 5 Apr. 2019. Table.
Tyack, David, and Elisabeth Hansot. “Hard Times, Then and Now: Public Schools in the 1930s and 1980s.” Harvard Education Review. JSTOR. Accessed 4 Apr. 2019. Originally published in Harvard Educational Review, Vol. 54, No. 1, Apr. 1984, pp. 33–66.
United States, Congress, Senate, Congressional Budget Office. Estimated Macroeconomic Impacts of the American Recovery and Reinvestment Act of 2009. Congressional Budget Office, 2 Mar. 2009, www.cbo.gov/sites/default/files/111th-congress-2009-2010/reports/03-02-macro_effects_of_arra.pdf. Accessed 9 Apr. 2019.
23 Billion. EdBuild, 26 Feb. 2019, edbuild.org/content/23-billion. Accessed 20 Apr. 2019.