BU Updates COVID-19 Dashboard Based on Total People Tested
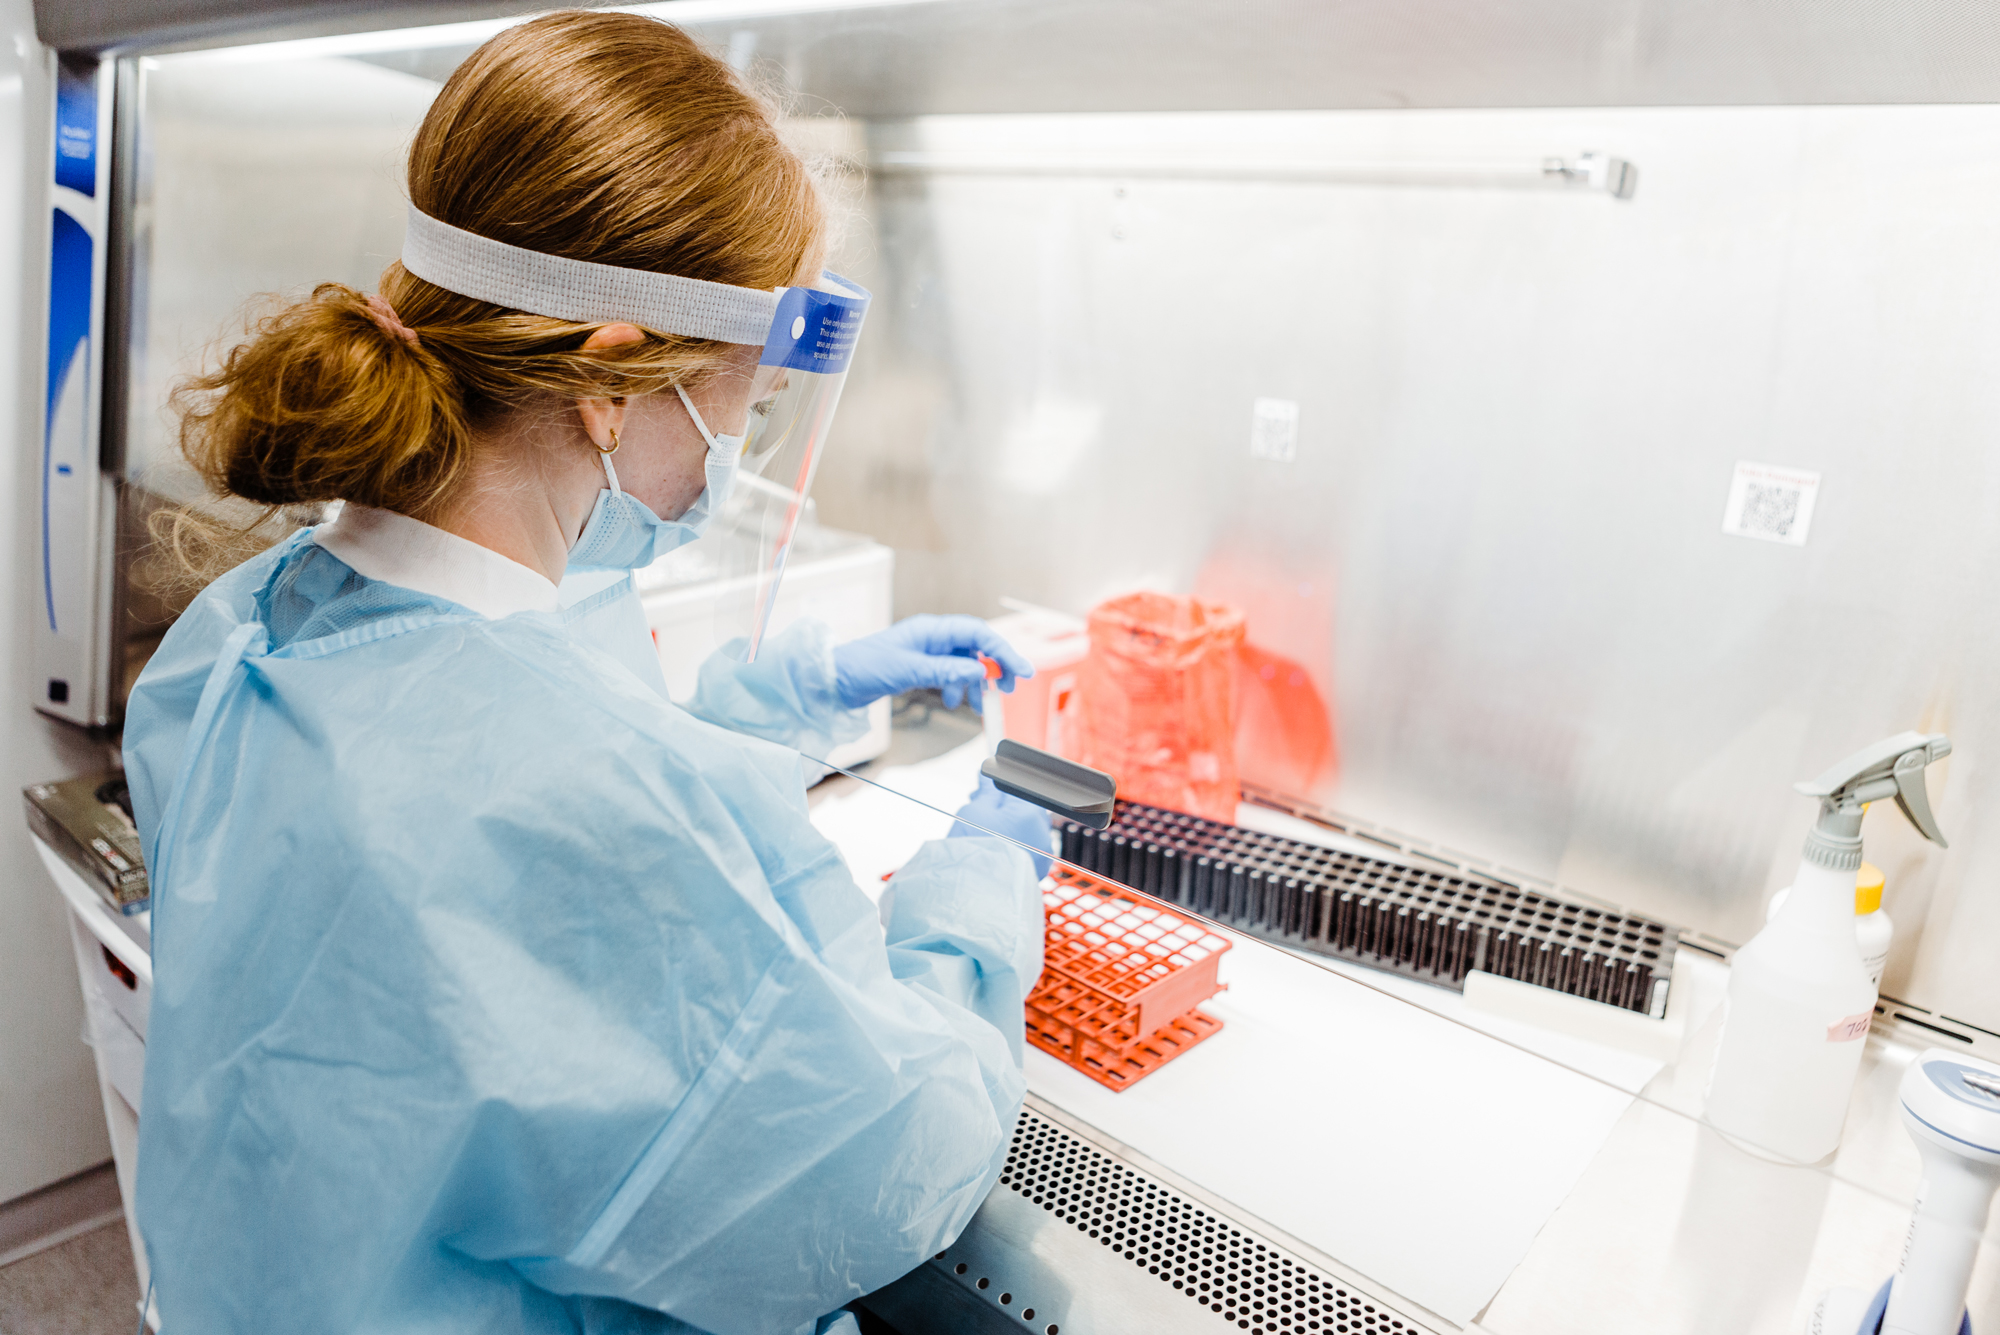
The BU Clinical Testing Lab processes thousands of COVID-19 tests per day. Now, the results of those tests will be posted to the public-facing test results dashboard using a new positivity rate calculation based on the number of individuals tested, not the number of tests processed. Photo by Janice Checchio
BU Updates COVID-19 Dashboard Based on Total People Tested
The new positivity rate addresses a frequent complaint from the BU community about how the testing data was being calculated
Visitors to Boston University’s coronavirus testing dashboard will notice a change on Monday. The dashboard now includes positivity rates calculated by dividing the total number of positive tests by the total number of individuals tested.
It’s one piece of data that members of BU’s community have clamored for, as they try to understand BU’s rate of people testing positive for COVID-19 in comparison to local communities and the state.
Up until Monday, BU’s positivity rates were calculated by dividing the total number of positive tests by the total number of tests administered. Given that the BU community has settled into the rhythm of the fall semester and its participation in the COVID-19 surveillance program, BU leaders decided it was time to update the way that coronavirus activity is monitored at BU.
“The big criticism has been that we’re comparing apples and oranges,” says Gloria Waters, BU’s vice president and associate provost for research, because the city and state numbers have historically included tests from mostly symptomatic people with a smaller number of tests coming from people being screened routinely. But with BU and other higher education institutions getting into the groove of surveillance testing, even the state’s numbers are becoming a blurry mix of symptomatic and surveillance numbers.
“Since August, higher education institutions have contributed around 760,000 test results to the state’s numbers,” says Davidson Hamer, a member of BU’s Medical Advisory Group and a BU School of Public Health and School of Medicine infectious disease and global health expert. Hamer is also a faculty member at BU’s National Emerging Infectious Diseases Laboratories and has provided guidance to the Massachusetts higher education reopening task force. “If people are routinely having one or two tests per week, that’s going to make the positivity rate look lower.”
Overall, Hamer says BU’s positivity rate is “really low…we’re doing super well, so far. It’s a tribute to the students in particular, but also to the faculty and staff, and the systems that BU has put in place to do this.”
Waters, who chairs the Community Health Oversight Group (CHOG), which scrutinizes BU’s testing data each day, says that it was time to start looking at the positivity rate just within BU, now that students have settled into their dorms and off-campus housing.
“We’re truly looking at positivity within our own community,” rather than focusing on identifying new arrivals carrying the virus with them from home, Waters says. “There are now very few new people entering our testing protocol—we are beyond the initial entry testing and into the surveillance testing.”
The new positivity rate will be calculated as a seven-day trend; some days there have been zero new positive results at BU, and other days have seen several positive results. “The way the data is presented is extremely important,” Hamer says. “We need to be looking at this data very carefully to see if there’s a rise in positivity inside the BU community or in our surrounding communities.”
Waters says the state is starting to break down its own numbers to account for all the surveillance testing happening at higher education institutions and in cities like Somerville and Cambridge, which are using pop-up testing stations to sample their communities for coronavirus. But given how many sources the state is compiling its data from, that process is complicated and slow. “We want to compare apples to apples, but right now we don’t have good data from the local counties,” Waters says. “Their positivity rate represents a hodgepodge of symptomatic, surveillance, and case-by-case requests for testing.”
BU and other universities are performing such a high volume of tests each week, Hamer says, that it’s important for the state to separate that data in its own reports. Otherwise, low positivity rates from campus surveillance programs could potentially obscure a rise in cases elsewhere in Boston.
The new denominator for BU’s dashboard will be recalculated every day, depending on the number of people who were tested in the last seven days. Positivity rates will be broken down by students, faculty, and staff so it’s easier to see which segments of BU’s community are experiencing more coronavirus infections.
Today’s numbers indicate that over the last seven days, .04 percent of tests administered to students were positive and .06 percent of individual students tested received a positive result; for faculty, those rates come out to .06 and .06 percent, and for staff, they were .16 percent and .17 percent.
“Looking at the individual positivity rates compared to what we’ve been using up to this point, they’re almost identical—they’re all very low,” Waters says. “It’s really reassuring looking at these numbers.”

Comments & Discussion
Boston University moderates comments to facilitate an informed, substantive, civil conversation. Abusive, profane, self-promotional, misleading, incoherent or off-topic comments will be rejected. Moderators are staffed during regular business hours (EST) and can only accept comments written in English. Statistics or facts must include a citation or a link to the citation.