Harnessing Learning Analytics
What is Learning Analytics?
Learning analytics is a significant area in education that has emerged during the last two decades. It strongly roots in multiple fields, including but not limited to business analytics, educational measurement, and educational data mining. Learning Analytics inherited those computational approaches to depict the network structures (actor–actor/social networks and actor–artefact networks), learning processes, learning content.
Significantly more efforts have been devoted to learning analytics in the past decades across the higher education landscape: more educational researchers started to use learning analytics at large scale, and almost all learning tools vendors would include an analytics feature to various extent in their products. In the student success process model developed by the ECAR-Analytics Working Group (Little et al., 2015), predictive learning analytics and action/intervention are located at the central position of the student learning process (Figure).

Figure. Position of predictive analytics in the path of student success
Learning Analytics @ Boston University
Educational communities often deal with challenges in the collection, integration, and use of large scale data originating from heterogeneous sources. Boston university aims to develop a standardized learning analytics data model surrounding the rapidly growing educational data. In 2020, we started to build automatic data flow from third party vendors to our data warehouse, and to the learning analytics dashboard.
Learning data from the learning management system, online learning discussion forum, instant messenger, and Zoom are integrated in the data warehouse. In order to provide a common-gauge rail for data cleaning, integration and visualization, we adopt Caliper as our learning event standard and encourage our third party vendors to adopt Caliper, too. Stable data flow allows us to build learning analytics dashboards to visualize student learning activities at university, program and individual level. We can provide learning activity analysis, social network analysis, content analysis, and retention prediction.

Who Can Use It?
University-level Analytics
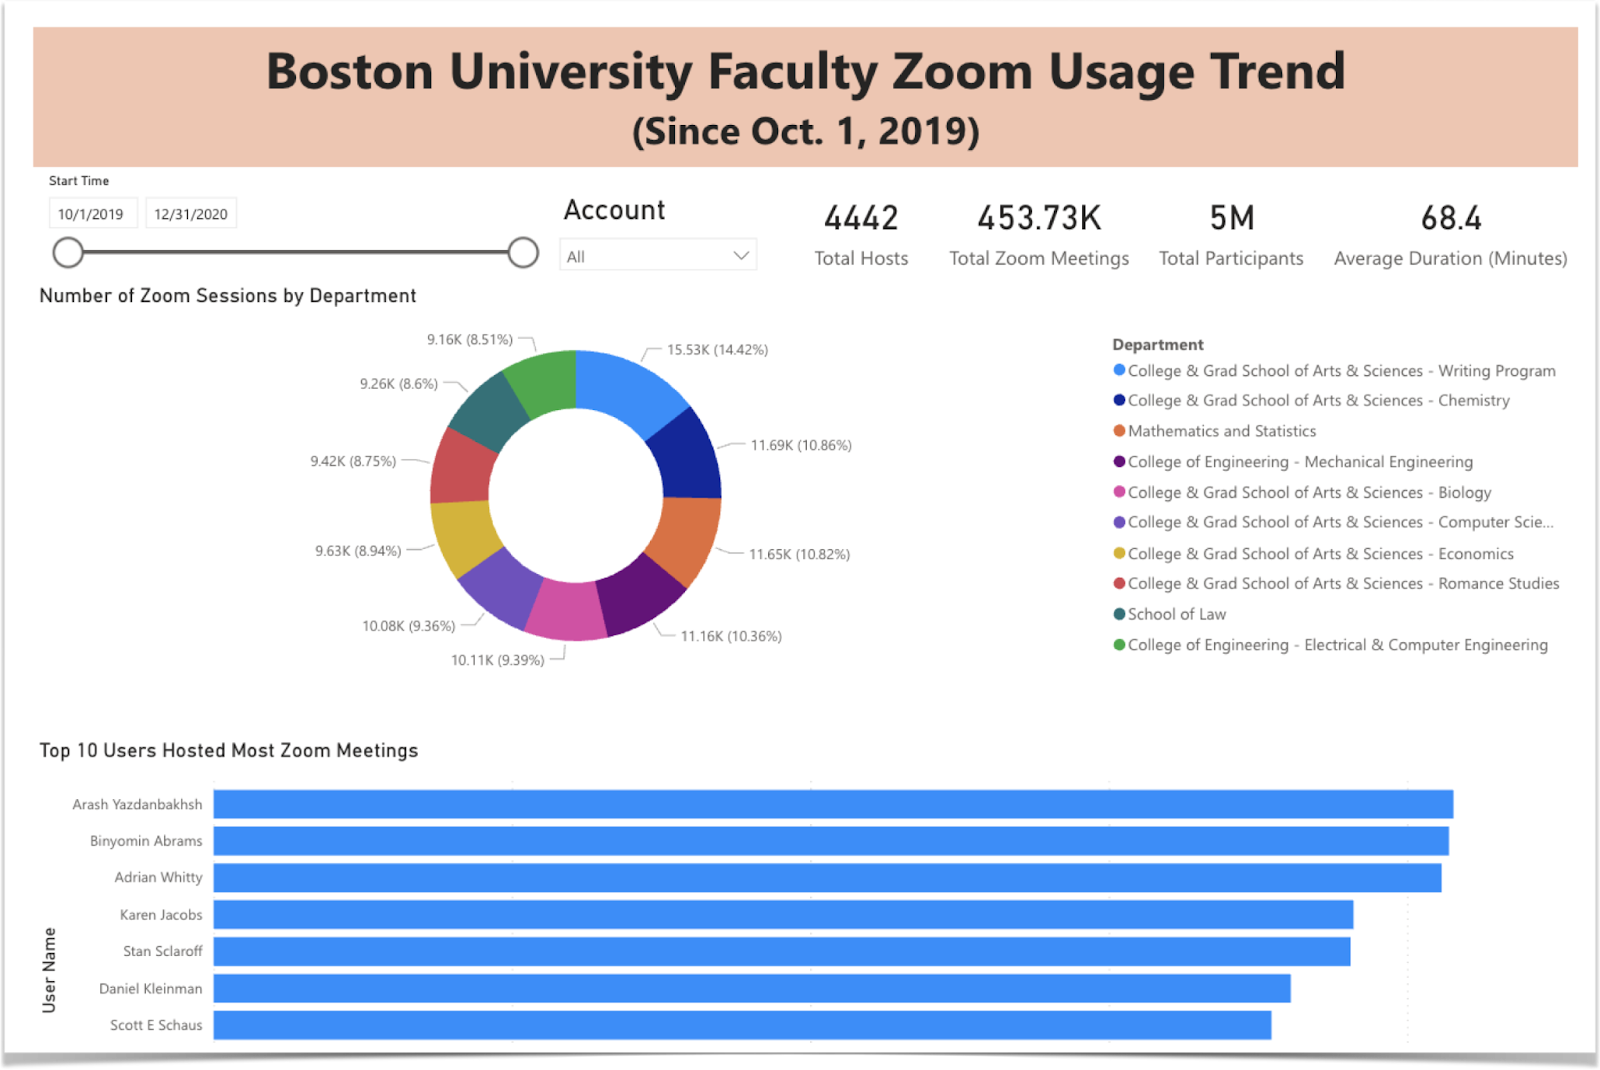
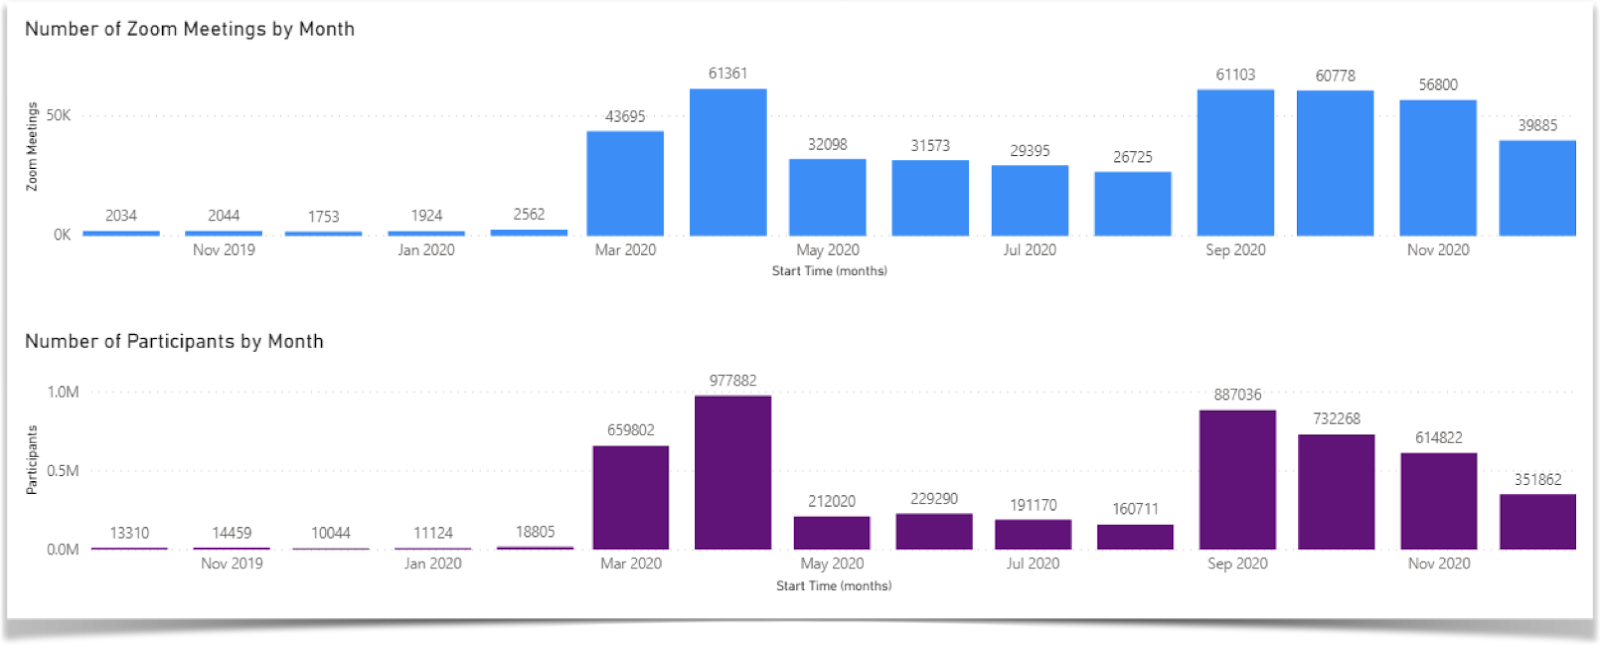
Learning Analytics Dashboards are provided for different audiences. During the period of Learning from Anywhere (LfA), we provide the learning analytics dashboards to visualize the university-wide technology usage.
Program-level Analytics
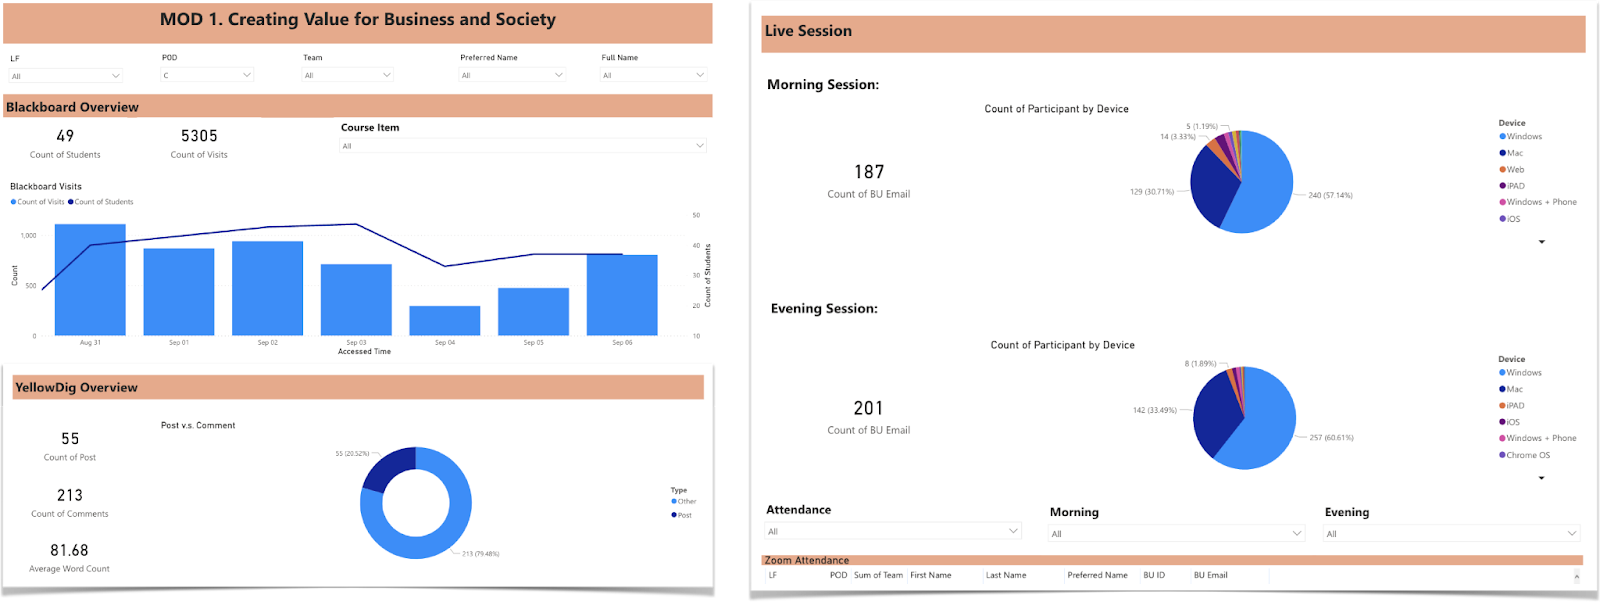
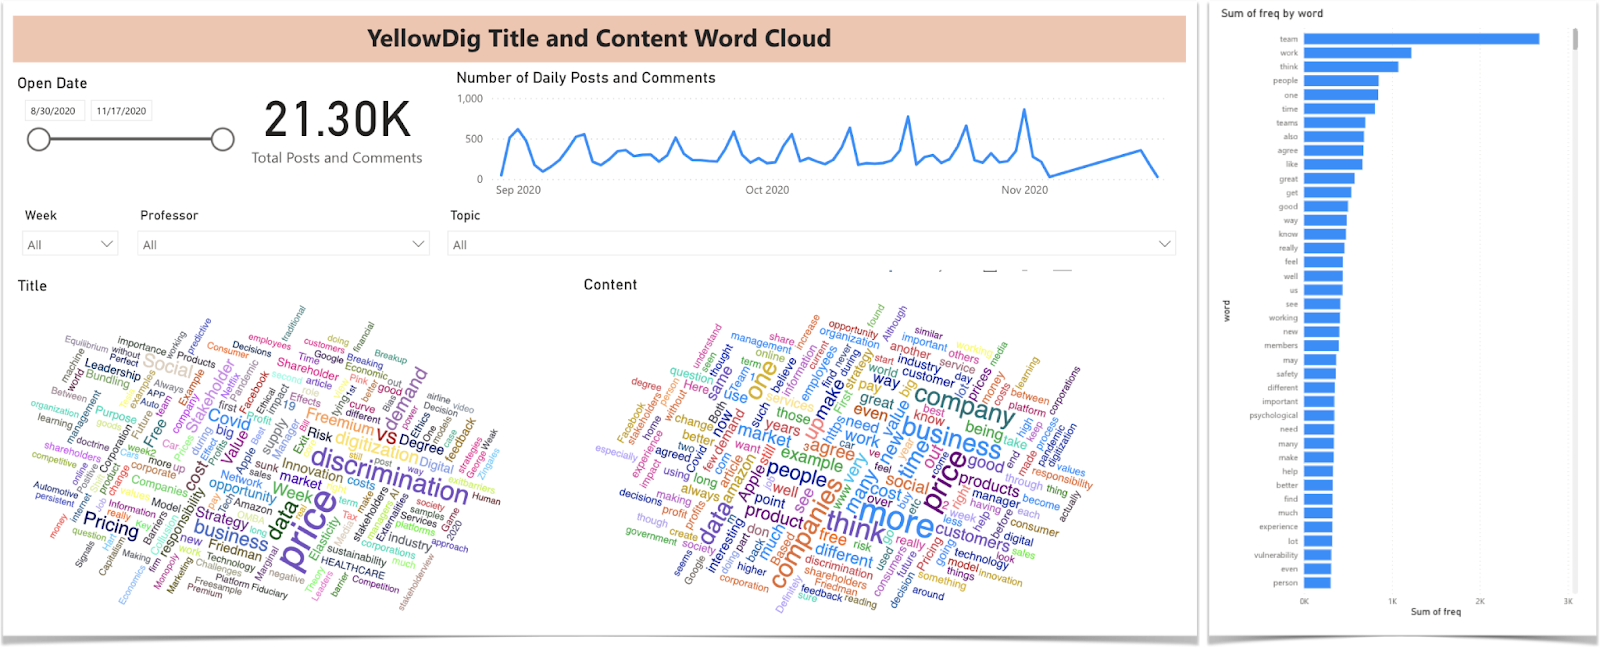
At the program level, we summarized the analytics from different tools in the same dashboard, the stakeholders can compare and validate the level of learning activities from the same cohorts of students. We can provide the trend of visits on each learning tool, content analysis of their discussion, social network of the learning community and assessment analysis.
Activity
 Content analysis
Social Network Analysis

Assessment Analysis

Individual-level Analytics
For each student in a specific course, we can also provide a profile dashboard to list all the past learning activities and performance.

Additional Resources
The aforementioned Learning Analytics Dashboards are created via Microsoft Business Analytics tool, Power BI. The student data is hosted on Boston University Microsoft SQL server, which provides secure and reliable access to confidential data.
- Data visualization: Power BI
- Data management: Microsoft SQL Server
Interested in exploring learning analytics at BU?
Email Educational Technology for a one-on-one consultation askedtech@bu.edu.